All flat world maps are inaccurate because the Earth is a sphere, not a rectangle. The Mercator projection — the one used in classrooms and on Google Maps — was designed in 1569 for navigation, and it distorts size dramatically near the poles: Greenland looks the size of Africa but is only 1/14th of it, and Antarctica appears as a vast strip when it’s really 14.2 million km². Equal-area projections like the Gall-Peters fix the size problem but distort shapes instead.
Yes, you may find this hard to believe, but all of our maps are wrong. No, Google Maps is not an exception to this rule. Maps have and will always be wrong. It’s just a part of human nature – or at least perception.
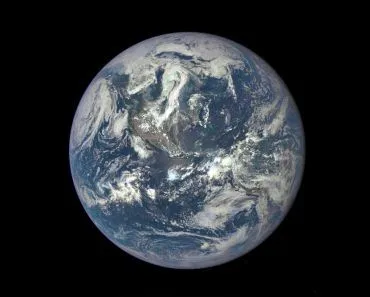
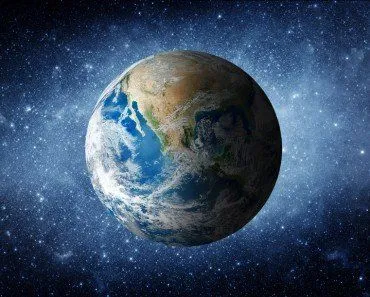
The thing is, maps are two-dimensional, while the Earth is three-dimensional. Our planet is an imperfect sphere, so flattening it out into a rectangular shape is impossible. What… you don’t believe me? Why don’t you see for yourself… Try pounding a completely intact orange peel into a flat rectangle.
Now, perhaps you understand. All maps are a lie, but they all lie about different parameters. Thus, the things that are chosen to be distorted in a map provides us with clear insight into human behavior.
The Mercator Map
The map most commonly used in the world is the Mercator map. This is the map that we see in classrooms all over the world. This is also the map that formulates our basic ideas of what our planet looks like. In fact, even Google Maps uses the Mercator map.
To be completely honest, it IS a convenient map. The latitudes and longitudes are straight lines that intersect perpendicularly, the rectangular shape is nice and compact for printing, and the shapes of the countries are well defined. However, the one thing this map does not get right is the relative sizes of the countries. The countries near the poles are portrayed as being much larger than they really are.
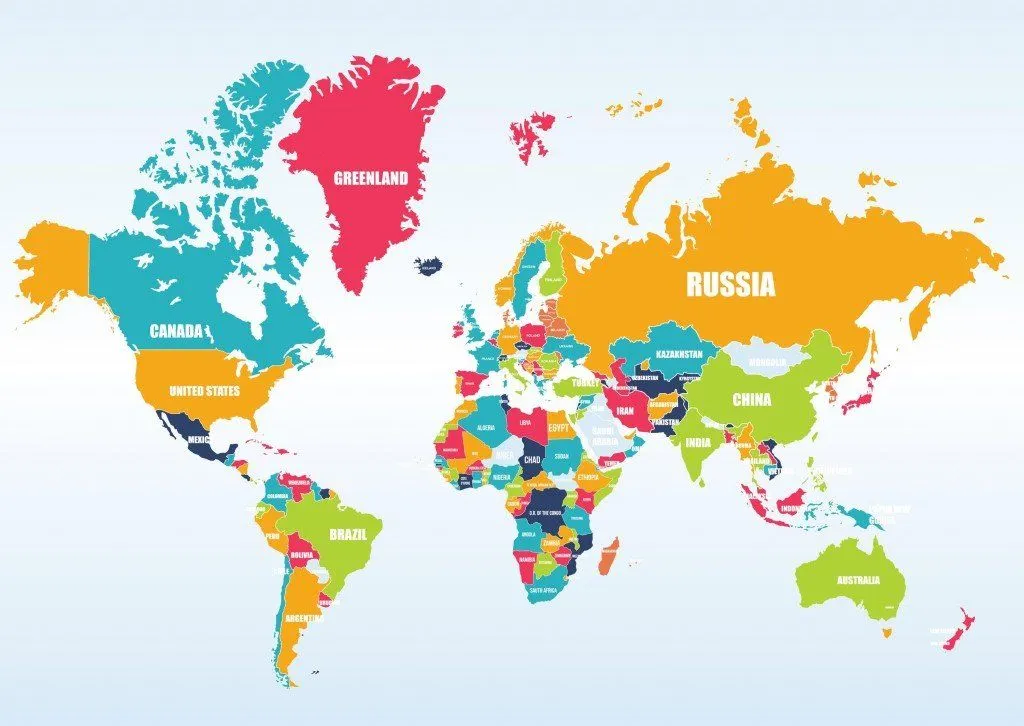
Take a good look at the map. Go on… Really look at it. North America seems larger than Africa, Scandinavian countries are larger than India, and Alaska looks bigger than Brazil. Greenland appears to be a large sparse island big enough to rival Africa.
This is the map that you’ve grown up with, so surely it isn’t that much of a lie, right? How bad could the disparity really be?
Answer: Extremely Bad.
Please allow me to show you the real world.

Why Are All Maps Wrong?
There are multiple issues and we will look at them one by one.
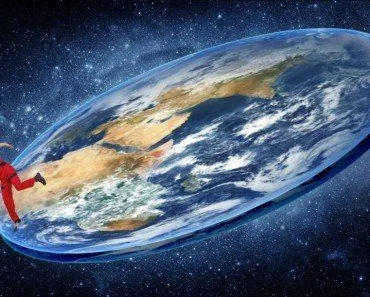
Why Can’t We Just Flatten The Globe?
Here is the uncomfortable truth sitting at the heart of every map: you cannot flatten a sphere onto a sheet of paper without breaking something. Remember that orange peel? The moment you tear it off and press it down, it splits, stretches, and refuses to lie flat. That isn’t clumsiness on your part. It is geometry. Because the Earth is a sphere and not a flat disc, every attempt to spread it out on a table is doomed before you even begin.

Back in 1827, the mathematician Carl Friedrich Gauss proved exactly why, in a result he was so fond of that he named it the Theorema Egregium, Latin for the “remarkable theorem”. Gauss showed that the curvature of a surface is an intrinsic property baked into the surface itself, and that simply bending the surface cannot change it. A sphere curves; a flat plane does not. Since the two can never be made to match without stretching, no map of the Earth can be laid flat without distorting something.
That single fact is why mapmakers are forever forced to choose. A projection can keep shapes faithful, or sizes faithful, or distances faithful, but never all three at the same time. The Mercator map chose to preserve shapes (and the straight-line compass bearings that sailors relied on). The price it paid was size, and as we have already seen, that price was brutal.
Is Africa Bigger Than North America?
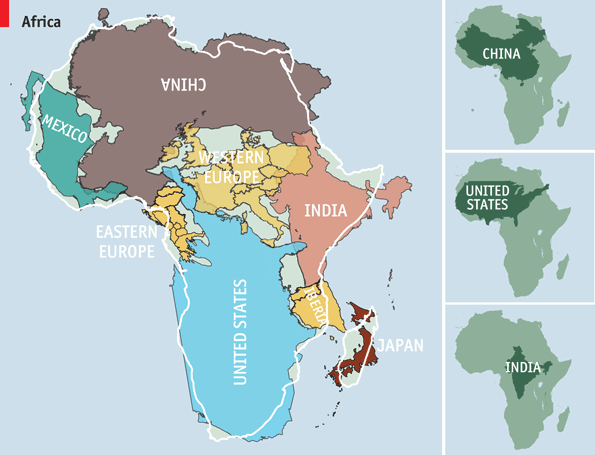
Let’s first address the elephant in the room. Africa. In reality, Africa is actually HUGE! It is 1.23 times the size of North America, despite the fact that in the Mercator Map, North America looks larger. As graphic designer Kai Krause famously visualized, you can drop the USA, China, India, Japan, and much of Europe inside Africa’s 30.37 million km² outline and still have room left over.
The Greenland Problem
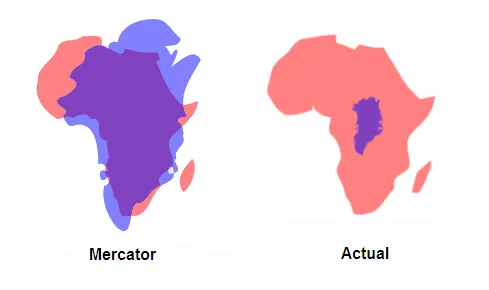
Then, there is the Greenland issue. Greenland’s ratio is WAY off. On the Mercator map, it looks as big as Africa, but in truth, it is only 1/14th of Africa’s size! Greenland is nowhere near the massiveness of Africa. It is tinier than the Democratic Republic of Congo – just a single one of Africa’s 54 nations. Greenland is so misrepresented that cartographers tend to call the size distortion of the Mercator map the ‘Greenland Problem’.
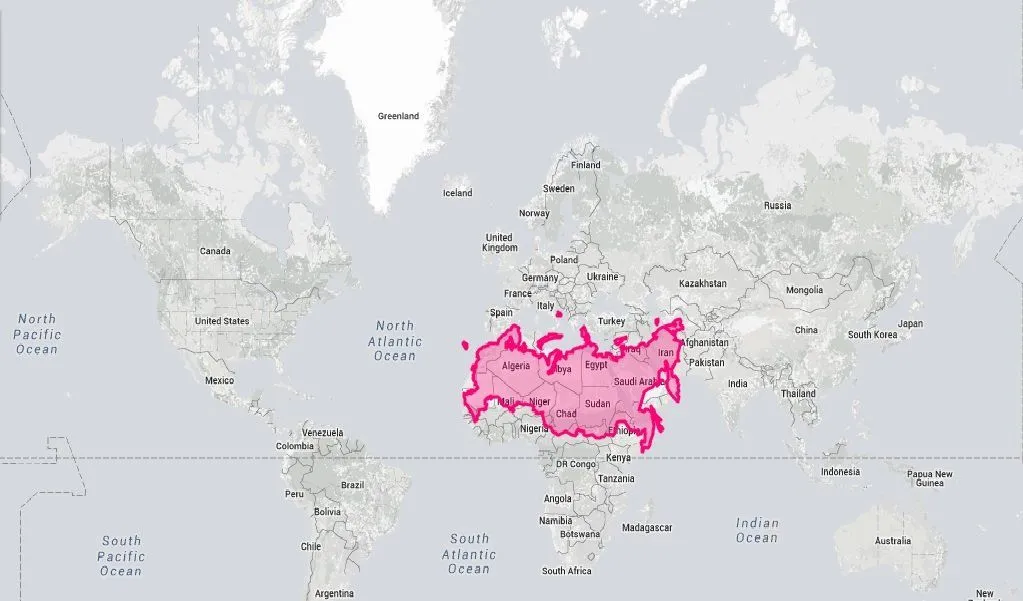
Then there are some more problems. Such as this one. Everything seems puny in comparison to Africa. For example, scroll up and compare Russia with Africa. It looks larger, right? Nope. Look again.
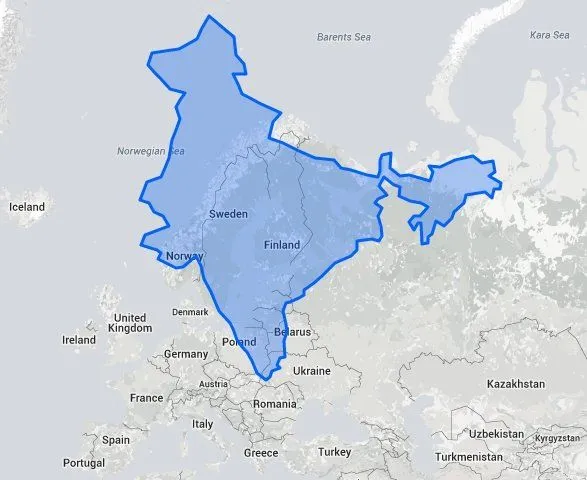
Even India appears to be much smaller than it actually is. In the real world, it happens to be roughly 3 times larger than the Scandinavian countries combined, which is why it can house the world’s largest population (it overtook China in 2023).
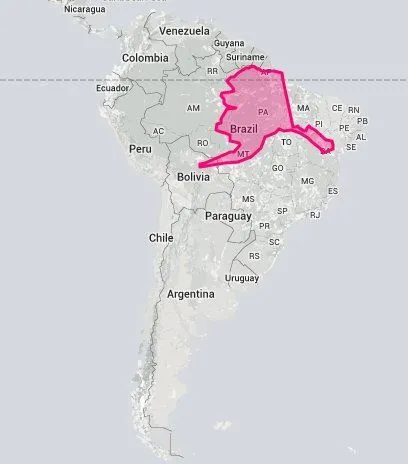
Alaska is also puny when compared to Brazil – it is 5 times smaller than the South American giant, and even Mexico is larger than Alaska in terms of area.
Antarctica is usually shown as a huge landmass at the bottom of the map, but how big is it really?
To understand our map even better, you should try using James Talmage and Damon Maneice’s interactive map project called The True Size. It lets you visualize how large countries really are.
How Big Is Antarctica Really?
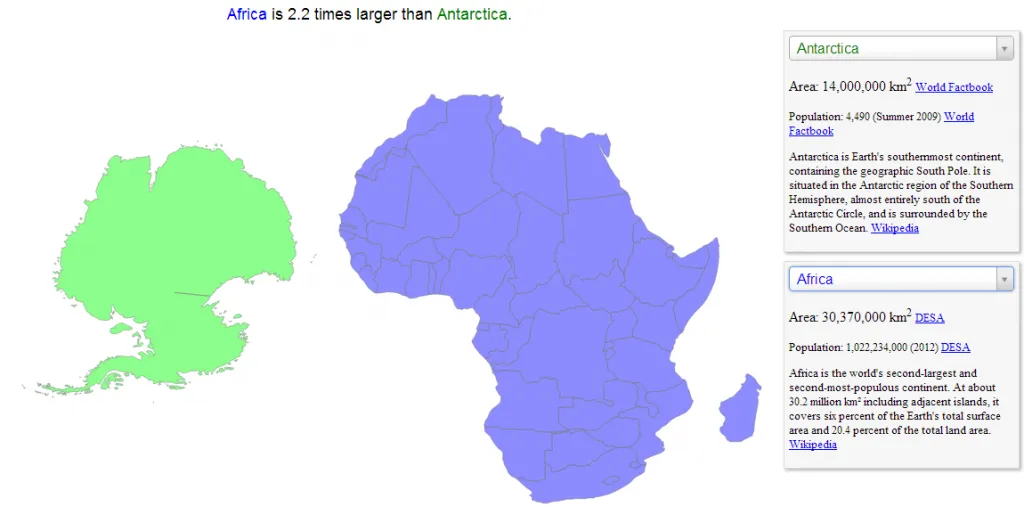
Let’s finally answer the question the map keeps dodging. On the Mercator projection, Antarctica sprawls across the entire bottom edge like a colossal white wall, dwarfing every other continent. In reality, it is only the fifth-largest continent, covering roughly 14.2 million km². That is almost double the size of Australia, yet it is well under half the size of Africa, which spans 30.37 million km². Put another way, you could fit Antarctica inside Africa more than twice over.

So why is the distortion down there even worse than Greenland’s? Because Antarctica sits right on top of the South Pole, and the Mercator projection stretches the map more and more violently the closer you get to a pole. At the pole itself, the stretching becomes mathematically infinite. To draw Antarctica truthfully on a Mercator map, you would have to smear it into an endlessly long horizontal band, which is impossible to print. That is exactly why most Mercator maps simply crop the continent off the bottom and quietly pretend it was never there.
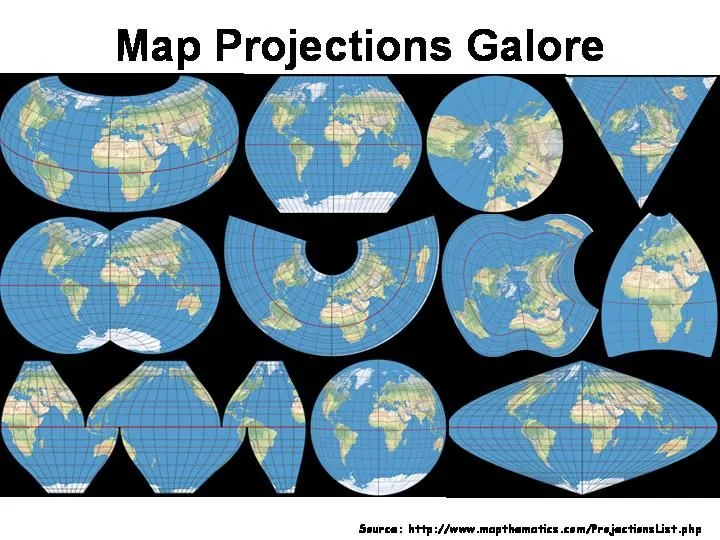
Which Map Projection Is The Least Distorted?
If every flat map is forced to distort something, the obvious next question is: which one gets closest to the truth? Cartographers have spent decades chasing better compromises, and a few of them stand out.
The Robinson projection, drawn by Arthur Robinson in 1963, deliberately gives up a little accuracy in every category in exchange for simply looking “right” to the human eye, and National Geographic used it on its world maps from 1988. In the late 1990s, the society switched to the Winkel Tripel projection, designed by Oswald Winkel back in 1921. Its name borrows the German word for “triple”, a nod to Winkel’s goal of taming three kinds of error at once: area, direction, and distance. A 2007 study by David Goldberg and J. Richard Gott found it had the lowest overall distortion of any standard world map they tested.

Newer designs push even further. The AuthaGraph map, created by Japanese architect Hajime Narukawa in 1999, wraps the globe onto a tetrahedron and unfolds it into a rectangle, keeping areas nearly true and, unlike Mercator, showing Antarctica in full; it won Japan’s Good Design Grand Award in 2016. The Equal Earth projection, published in 2018, keeps every country at its correct relative size while still looking pleasingly round and globe-like, and it has since been adopted by NASA, the World Bank, and National Geographic.
This argument is no longer purely academic. In August 2025, the African Union formally backed the “Correct the Map” campaign, which urges schools, publishers, and institutions to retire the Mercator projection in favor of an equal-area map such as Equal Earth. Their case is the one this whole article has been making: centuries of shrinking Africa on the page have quietly shaped how the rest of the world sizes up the continent.
MAPS Vs REALITY
Because the distortion of Antarctica is so severe, cartographers tend to just crop the continent off. However, that leads to another new problem. The northern hemisphere, in this case, appears larger than its southern counterpart.
The aggrandizing of the northern areas is where the real issue lies. The map that we still use today — drawn by the Flemish cartographer Gerardus Mercator in 1569 — was actually designed to help sailors during the Age of Discovery: it’s the only projection in which a constant compass bearing (a rhumb line) appears as a straight line, which made it indispensable for navigation. The flattering side-effect that it visually inflates the colonizing European powers in the north was a happy accident that nobody at the time was rushing to fix.
Peters Projection Map
The truth is that the map could have been created with any number of different distortions. Take the Gall-Peters map projection, for example (shown below). This equal-area projection preserves the relative sizes of countries; the price is that the shapes (and distances) get noticeably stretched, especially near the equator.
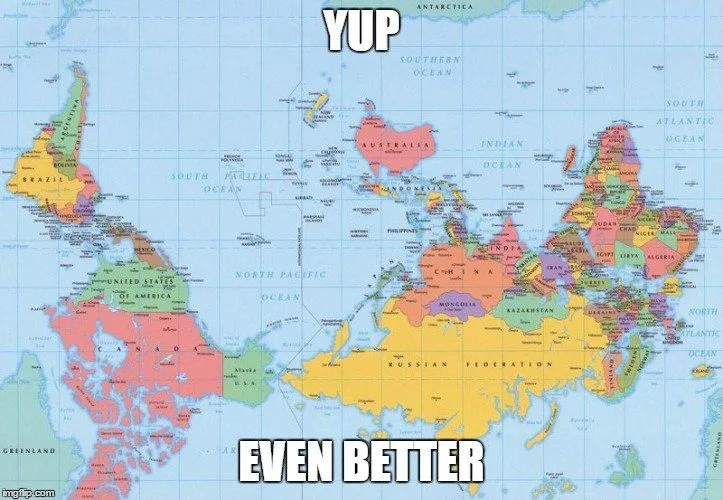
No, Maps Don’t Need To Be Rectangular In Shape!
A map doesn’t even necessarily need to be rectangular in shape. To achieve correct shape, size, AND distance, there are a number of ways to represent a map in a much better way, so we have an accurate image of reality.
Also, why does the North have to be north anyway? Why does Europe have to be at the top of the map? Space is infinite, which means that there is no “Up” or “Down” in the universe.
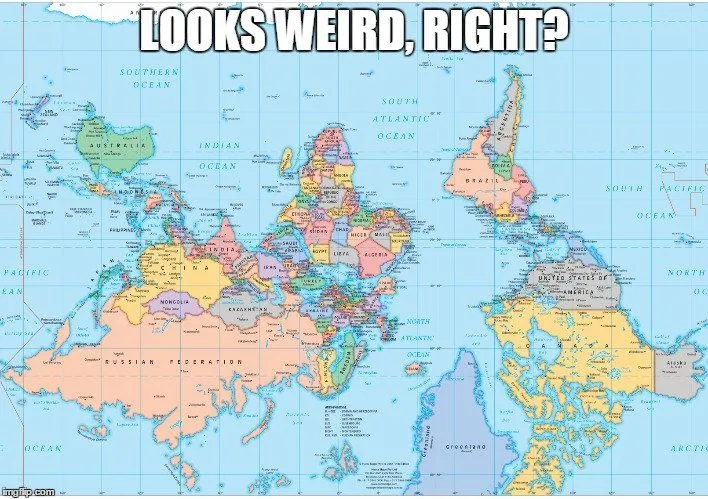
Furthermore, why does West have to be west? North America is closer to Asia than it is to Europe, so why is the International Date Line between them? Why does the Prime Meridian, the central line of longitude, pass through Western Europe? There can only be one Equator, considering the Earth’s axis, but the Prime Meridian is a completely arbitrary line that could have been drawn anywhere.
However, of all the possible map projections, 16th century Europeans felt the most comfortable with choosing one that inflated their countries to match the size of their egos. Central position, top of the world, and enlarged countries – how could the Europeans resist the temptation? As we hear so often, the victors write the history books, and apparently, they also draw the maps!
Don’t get me wrong. I don’t blame those European rulers and cartographers. In 1623, a Chinese terrestrial globe was made for the Chinese Emperor by the Jesuit missionaries Manuel Dias and Niccolò Longobardi. The creators exaggerated the size of China and placed it in the middle of a world that otherwise consisted of small offshore islands.
The point that I’m trying to make is that all of our maps are doomed to be wrong. There is no single perspective from which to view the Earth, and no matter what we do, our social and political biases will shine through. An alien sketching our planet might end up drawing something completely different from what we’re using today.
I’m not saying that we should all change our maps overnight, as that would be pointless after all this time. However, what we can do is remember how arbitrary maps truly are. Everyone should know that they don’t reflect the truth, but rather the history of how our accepted “truths” came to be.
What must be understood is this…Our world is much more complex and beautiful than a simple two-dimensional projection of it. Go out and see for yourself!
References (click to expand)
- The True Size Of .... thetruesize.com
- Mercator Map of the World. Arizona State University
- The Earth is Not Round! Utah, NAD83 and WebMercator .... gis.utah.gov
- Mercator, It's Not Hip to Be Square - Esri. Esri
- Theorema Egregium. Wikipedia
- Antarctica. Wikipedia
- Winkel tripel projection. Wikipedia
- Equal Earth projection. Wikipedia
- African Union backs campaign to replace Mercator map. KUOW/NPR