The cosmology crisis, or Hubble tension, is a stubborn mismatch in the universe’s expansion rate. The local distance-ladder method gives a Hubble constant of about 73 km/s/Mpc, while the cosmic microwave background gives about 67 km/s/Mpc. As of 2026, despite new James Webb and DESI data, the gap remains unresolved.
Humans have come a long way in our urge to understand the universe and the various structures it holds, including galaxy clusters, star systems, and so much more. We have created theories to explain various phenomena and devised clever experiments to test them.
Sure, many phenomena have been discovered and understood, but there are plenty of things still left to be found.
In this article, we will investigate one of them: the rate at which the universe expands.
To find out how fast the universe is expanding, we need a combination of both theoretical backgrounds and experimental approaches, mostly involving observations.
On the theoretical side, we need a model of the universe that can describe concrete aspects, like its overall shape and curvature, its composition, etc. Using the data obtained from observations, along with some mathematical calculations, we can determine the expansion rate.
The Lambda-CDM Model Of The Universe
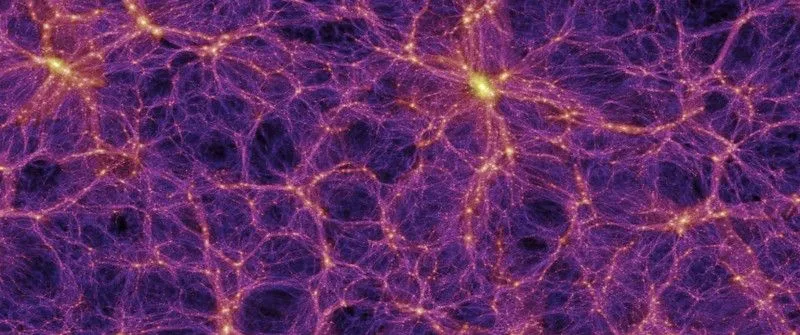
Currently, the most accepted model of the Universe is the Lambda-CDM model, also called the Standard Model of Cosmology. CDM stands for Cold Dark Matter, while ‘Lambda’ is a Greek letter representing dark energy. This is an analytical model that may describe several observable phenomena in the universe.
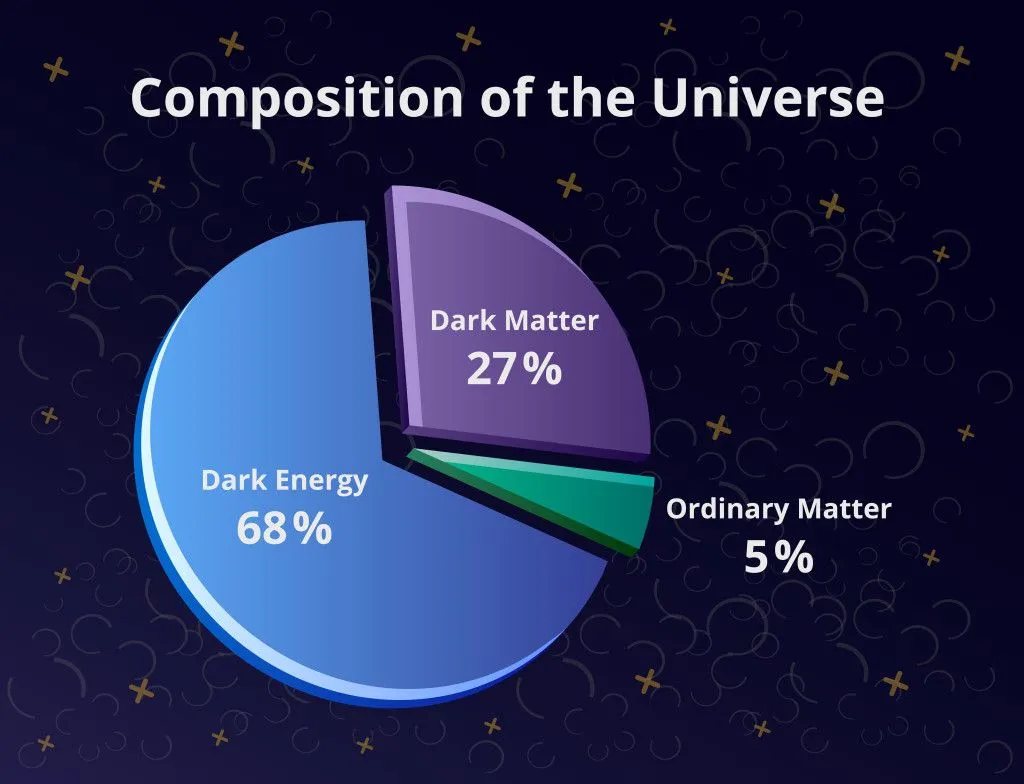
The model makes use of six parameters, as well as several assumptions, to describe the Universe. Some necessary assumptions are that the Universe is mostly the same everywhere and that general relativity can sufficiently explain gravity. It also assumes that the Universe has the following constituent parts:
- Dark energy, responsible for the Universe’s accelerated expansion,
- Dark matter, a theoretical form of matter that interacts only gravitationally,
- Normal ordinary matter that makes up the stars, planets, galaxies, etc.,
- The Cosmic Microwave Background (CMB),
- Neutrinos
The Standard Model of Cosmology derives its mathematical framework from Albert Einstein’s General Theory of Relativity. In this framework, a quantity called the Hubble parameter represents how fast the Universe expands.
The value of the Hubble parameter has been changing throughout the history of the universe and will continue to do so in the future. The present value of the Hubble parameter is called the Hubble constant. Measuring the Hubble constant tells us how fast the universe is expanding in the current age.
In modern astronomy, there are two ways to measure the value of the Hubble constant. One method finds distances to faraway objects and then determines their redshifts. With a redshift versus distance plot, we can obtain the value of the Hubble constant. The second method uses observations and measurements of the Cosmic Microwave Background. Let’s look at both of these techniques.
The Distance-Redshift Measurement
The main component of the first method is measuring distances, particularly distances to faraway galaxies. As we know, outer space spreads far and wide, so to be able to measure the distance to these remote objects, astronomers employ various techniques, such as parallax methods and Cepheid variables, to accurately measure them.
Usually, the method used largely depends on the distance of the objects. We use techniques like parallax to determine the distance of nearby stars, but to determine the value of the Hubble constant, we need distances to faraway galaxies. To measure such distances, astronomers use Cepheid variables and Type 1A supernovae.
Astronomers regard Cepheid variables and Type 1A Supernova as ‘standard candles’, because we accurately know their absolute magnitude, i.e., the total amount of light these objects emit. Usually, determining the absolute brightness of entities like stars is very difficult, but there are exceptional objects where the absolute magnitude is known. These are known as standard candles.
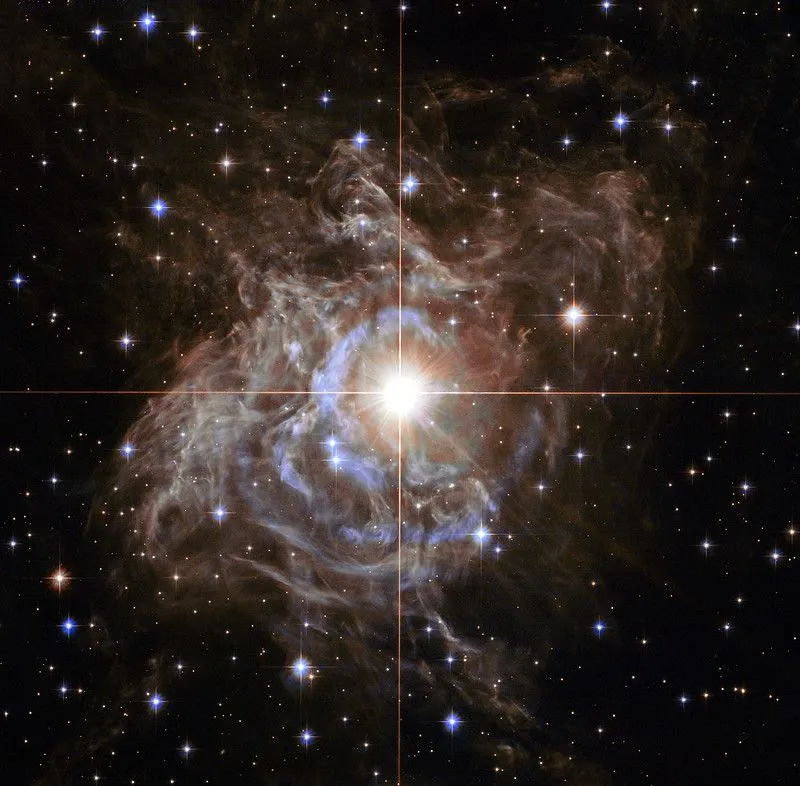
We use standard candles to find distances. The further an object is from us, the dimmer it will appear, a principle used in measuring distances. Using a standard candle whose absolute magnitude is known, we can determine how far away the object is by identifying how bright it appears on Earth.
Cepheid variables refer to stars that change in brightness in regular periods. By detecting these objects in nearby galaxies, we can use the above principle to measure the distance to that galaxy. It is important to note that this works only for nearby galaxies, as it is difficult to distinguish individual stars in far-off galaxies. For such cases, astronomers measure distances using Type 1A supernovae.
Now that the distance part is covered, the next part is the redshift. Redshift is caused by the Doppler effect, in which light from distant objects gets shifted to lower wavelengths. It appears this way because these objects are moving away from each other, due to the expansion of the Universe.
Given this expansion, the objects are moving away with a certain velocity. The redshift we observe on Earth is, in essence, a measure of this velocity; the higher the speed, the greater the redshift.
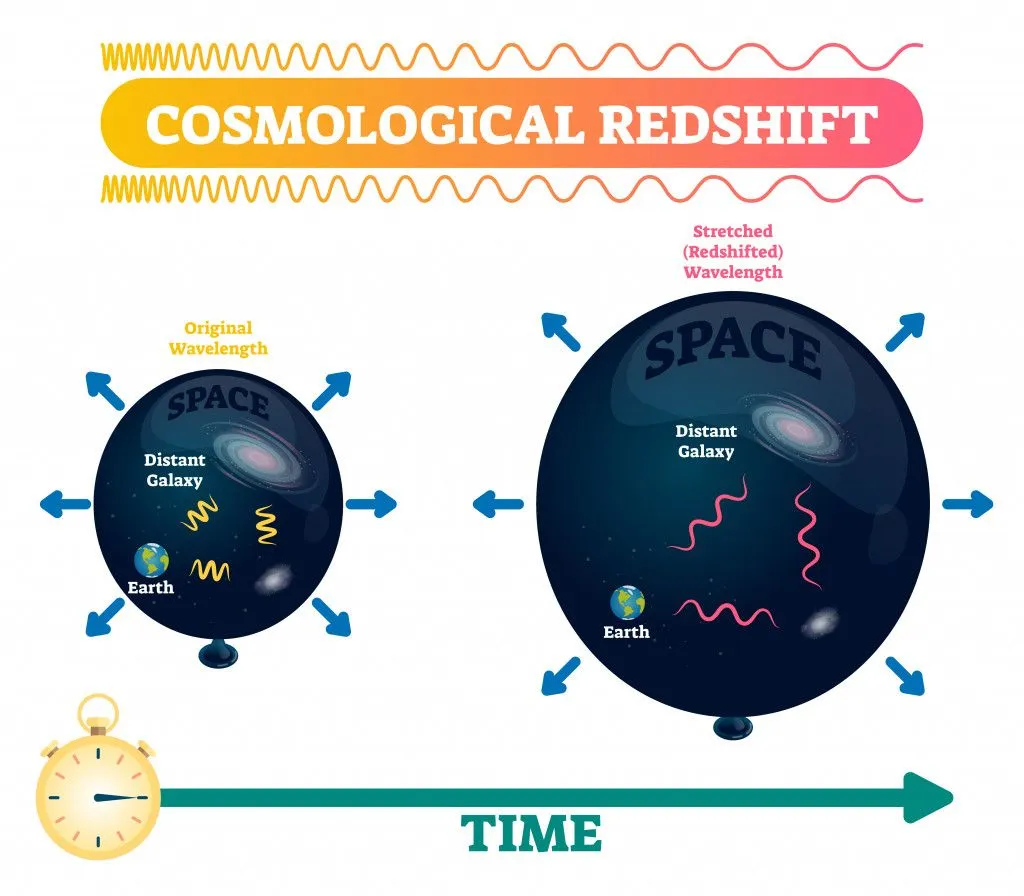
By measuring these two quantities (the redshift, z, and the distance, D), one could measure the Hubble constant, H0, by plotting out the equation,
Using this method, the SH0ES team obtained a Hubble constant of 73.0 ± 1.0 km/(s Mpc) in 2022, the most precise distance-ladder measurement at the time. Earlier results from the same method clustered close to this value. In 2024, the same team re-observed many of these galaxies with the James Webb Space Telescope, whose sharper infrared vision can pick out individual Cepheids in crowded star fields. The Webb data agreed with the earlier Hubble Space Telescope measurements and yielded 72.6 ± 2.0 km/(s Mpc), arguing that the high local value is not simply a measurement error caused by blended stars.
The Cosmic Microwave Background Measurement
The second method used to measure the Hubble constant is derived from the Cosmic Microwave background. The Cosmic Microwave Background (or CMB) is the remnant of the first ‘free’ radiation produced in the universe. It is known as ‘free’ because, before the creation of the CMB, the universe had very high temperatures. These high temperatures caused light (or photons) to be repeatedly scattered by highly energetic electrons, protons, and other particles. As a result, the photons would bounce around wildly, making the whole universe appear opaque.
However, with time, the expansion of the Universe also caused it to cool down, allowing the electrons and protons to combine and form atoms. With atoms forming, the photons were no longer scattered and could travel without hindrance. The first set of photons that could do this became the CMB that we see.
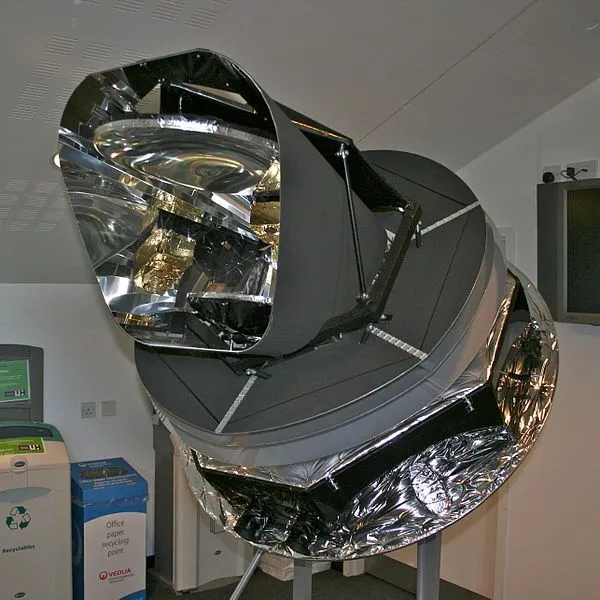
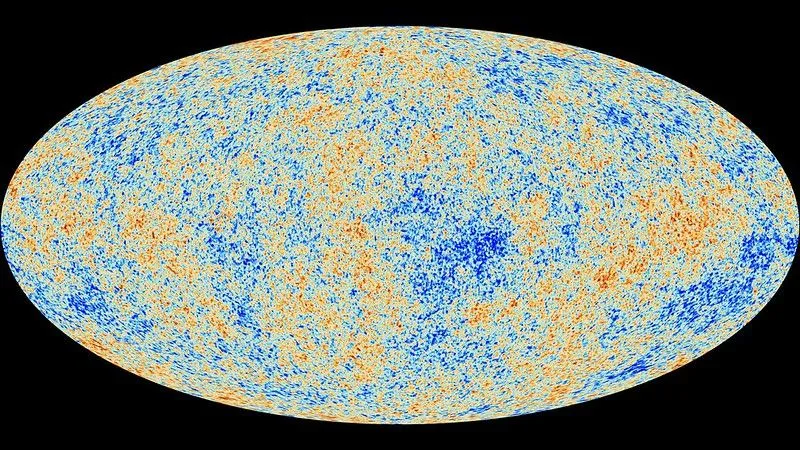
The Planck satellite is the spacecraft that recorded the latest observation of the CMB. One of its primary missions was to detect the temperature differences present in the CMB. That would give us some idea of how the Universe appeared around 380,000 years after its formation, when light was first traveling freely.
Astrophysicists used these variations (scientifically referred to as anisotropies) to study the subsequent evolution of the universe. By comparing it to how the Universe and its large-scale structures currently looks, we can find properties like the expansion rate and temperature. While this is a rather indirect method, it does provide another way of measuring the Hubble constant.
In 2018, scientists published the final set of results using Planck data. From those, astronomers derived a Hubble constant of 67.4 ± 0.5 km/(s Mpc). Earlier measurements from the Planck satellite yielded similar values. This figure is stubbornly lower than the one obtained using Type 1A supernovae and Cepheid variables (73.0 km/(s Mpc)), and the gap remains even after accounting for instrumental and other random errors. Statistically, the two measurements disagree at roughly the 5-sigma level, which means the odds of the mismatch being a fluke are extremely small.
The Cosmology Crisis
This mismatch in the value of the Hubble constant has been termed the ‘Cosmology Crisis’ or the ‘Hubble Tension’. This disparity in the value of the Hubble constant is wide enough that we know something is either missing or seriously wrong.
The missing aspect could be an undiscovered element of physics relating to how the structure of the Universe evolved. This may seem like an exciting prospect, but pinning it down requires fresh, high-quality data. That is exactly where newer instruments come in. The James Webb Space Telescope is already sharpening the distance ladder, while LIGO ran its fourth observing campaign from May 2023 to November 2025 and logged more than 250 gravitational-wave detections, opening yet another independent route to the Hubble constant.
The other possibility is that something might be wrong in our calculations or conceptions of this question. Regardless, it is essential to find where the mistake is. One way to tackle this is to devise newer methods to find the Hubble constant. Another distance measurement uses a technique called the Tip of the Red Giant Branch (or TRGB), which relies on the predictable brightness of aging red giant stars rather than Cepheids. TRGB measurements tend to give a Hubble constant between roughly 69 and 71 km/(s Mpc), landing between the Cepheid/Type 1A supernova value and the CMB value. The Chicago-Carnegie Hubble Program has pushed this further with the James Webb Space Telescope, combining TRGB stars and a newer method based on carbon-rich J-region asymptotic giant branch (JAGB) stars. Their JWST-only results sit around 68 to 69 km/(s Mpc), close to the CMB number, leading that team to argue that no new physics may be required. The SH0ES team, by contrast, still finds about 73 km/(s Mpc). Webb has therefore sharpened the debate rather than settling it.

Could Dark Energy Be Changing?
The Hubble tension is not the only crack appearing in the Standard Model of Cosmology. The Lambda-CDM model assumes that dark energy is a fixed quantity, the unchanging ‘cosmological constant’ that Einstein first wrote into his equations. Recent observations have started to question even that assumption.
The Dark Energy Spectroscopic Instrument (DESI), mounted on a telescope in Arizona, maps the positions of millions of galaxies and quasars to trace a feature called baryon acoustic oscillations. These are faint, regular ripples frozen into the distribution of matter, and they act as a cosmic ruler for measuring how the expansion has changed over billions of years. In 2025, DESI released results based on nearly 15 million galaxies and quasars collected over three years.
On their own, the DESI measurements still fit the standard model. But when combined with cosmic microwave background data and supernova surveys, they show a persistent hint that dark energy may not be constant after all, and that its push could be weakening over time. Depending on which supernova dataset is used, the evidence for this evolving dark energy ranges from about 2.8 to 4.2 sigma. That is intriguing, but it falls short of the 5-sigma threshold physicists demand before claiming a discovery.
If this result holds up, it would not directly close the Hubble tension, but it would tell us that our picture of the universe is incomplete in more than one way. Both puzzles point to the same conclusion: the cosmos still has surprises in store.
A Final Word
The Hubble constant is probably one of the most fundamental parameters of the Universe. Apart from just quantifying the expansion rate, it also tells us the age of the Universe and appears in the Friedmann equations. In a way, the Hubble constant is one of the keys to understanding how the Universe changes over time.
In a way, having problems like the Cosmology Crisis is what pushes scientific research forward. After all, people make groundbreaking discoveries when there is a problem or situation to address. The Cosmology Crisis is the latest in a long line of questions and obstacles that scientists inevitably face. As of 2026, despite sharper data from the James Webb Space Telescope and DESI, the tension is still very much unresolved. As mentioned before, there is either some new, undiscovered physics to study or a mistake made somewhere that needs to be identified and remedied. Determining the truth in such hotly debated academic “crises” polishes our knowledge of science and drives our scientific achievement forward!
References (click to expand)
- Freedman, W. L., Madore, B. F., Hatt, D., Hoyt, T. J., Jang, I. S., Beaton, R. L., … Seibert, M. (2019, August 29). The Carnegie-Chicago Hubble Program. VIII. An Independent Determination of the Hubble Constant Based on the Tip of the Red Giant Branch*. The Astrophysical Journal. American Astronomical Society.
- GS Anand. (2022) Comparing Tip of the Red Giant Branch Distance Scales. Hing
- N Aghanim. (2020) Planck 2018 results - I. Overview and the cosmological .... Astronomy & Astrophysics
- Astronomical Redshift | Imaging the Universe. University of Iowa
- W Freedman. (2002) The expansion rate of the universe - Oxford Academic. Oxford University Press
- Hubble law and the expanding universe. Georgia State University
- Cosmic Microwave Background (CMB) radiation. European Space Agency
- ESA - Planck. European Space Agency
- Explanation of the cosmic distance ladder. University of Western Australia
- Riess, A. G., et al. (2022). A Comprehensive Measurement of the Local Value of the Hubble Constant from the Hubble Space Telescope and the SH0ES Team. The Astrophysical Journal Letters.
- Planck Collaboration (2020). Planck 2018 results. VI. Cosmological parameters. Astronomy & Astrophysics.
- Freedman, W. L., et al. (2025). Status Report on the Chicago-Carnegie Hubble Program: Measurement of the Hubble Constant Using the Hubble and James Webb Space Telescopes. The Astrophysical Journal.
- New DESI Results Strengthen Hints That Dark Energy May Evolve. Lawrence Berkeley National Laboratory (2025).
- LIGO-Virgo-KAGRA Complete Fourth Observing Run. LIGO Laboratory, Caltech (2025).