Buffer capacity (β) is a quantitative measure of how much acid or base a buffer solution can absorb without its pH changing significantly. It is formally defined as the number of moles of strong acid or strong base needed to change the pH of one liter of buffer by one unit. Buffer capacity is highest when the buffer’s pH equals the pKa of its weak acid component, and falls off as you move away from pKa.
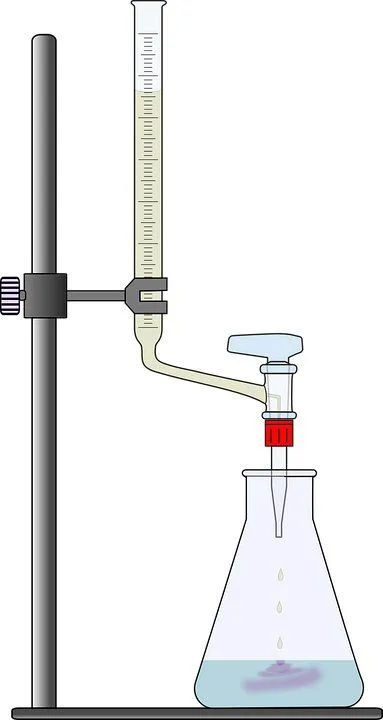
If you remember high school chemistry or took a college course like Chemistry 101, you will have conducted a titration test. Personally, the first time I let the liquid percolate at the bottom of the glass flask, patiently waiting for the solution to turn to a tinge of pink or magenta, it honestly made me feel like a scientist! However, why does this solution change color only when a certain amount of chemicals are added? To get that answer, we must understand the inherent properties of the solution.
Buffer Capacity: Definition
Before we get into what a buffer capacity is, we should first understand buffers. A buffer is a solution that resists changes in pH when a limited amount of acid or base is added to it. The chemical composition of a buffer solution usually entails a weak acid or a weak base accompanied by its conjugate salt.
Now, Buffer Capacity can be defined as the measure of the efficiency of a buffer in resisting its change in pH. This definition does present a bit of a problem as to ‘what is the significant change?’ Sometimes, a change of 1 unit does not bring about any significant change. At other times, even a 0.1-unit change can cause a significant difference. So, to give a more clear definition, buffer capacity may be defined as the quantity of a strong acid or strong base that must be added to one liter of a solution to change it by one pH unit. The buffer capacity equation is as follows: where n is the number of equivalents of added strong base (per 1 L of the solution). Note that the addition of n moles of acid will change the pH by the same value, but in the opposite direction. We will derive a formula connecting buffer capacity with pH, pKa and buffer concentration.
The buffer region shows up clearly on a titration curve. Open the simulator below in weak-acid mode (acetic, ammonia, or phosphoric), titrate with a strong base, and watch the curve flatten out near the pKa. That flat zone is where buffer capacity is highest.
Calculation Of Buffer Capacity
Now that we have seen how the buffer equation can be written, let’s try to derive it to have a better understanding of how we arrived at the above equation. To make this derivation a bit easier, we shall make the weak acid monoprotic (an acid, HA, that can donate only one proton). We shall also assume the volume to be one, as this helps us treat concentration and the number of moles interchangeably. The charge balance of the solution we assume is demonstrated by the following equation:
[A–]+[OH–]=[B+]+[H+]
[B+] denotes the presence of a strong base concentration in the solution. The [B+] is also the n present in the first buffer capacity equation. Now the total concentration of the buffer is given by the following equation:
Cbuff =[HA]+[A–]
The [HA] in the above equation can be broken down into smaller constituent elements. This splitting of a molecule into ions is called dissociation, and the equilibrium constant that describes how far it goes is the dissociation constant, which makes the derivation much easier to simplify. The Ka in the below equation is the acid dissociation constant. It relates to how easily a molecule will act as an acid.
[HA]=([H+][A–])/Ka
Now, the above equation can be substituted in the buffer concentration equation, giving the following equation:
Cbuff= ([H+][A–])/Ka + [A–]
Now, if we were to take [A–] as a common factor and LCM to simplify the above equation, we would get the following equation:
[A–]= (Cbuff·Ka)/(Ka+[H+])
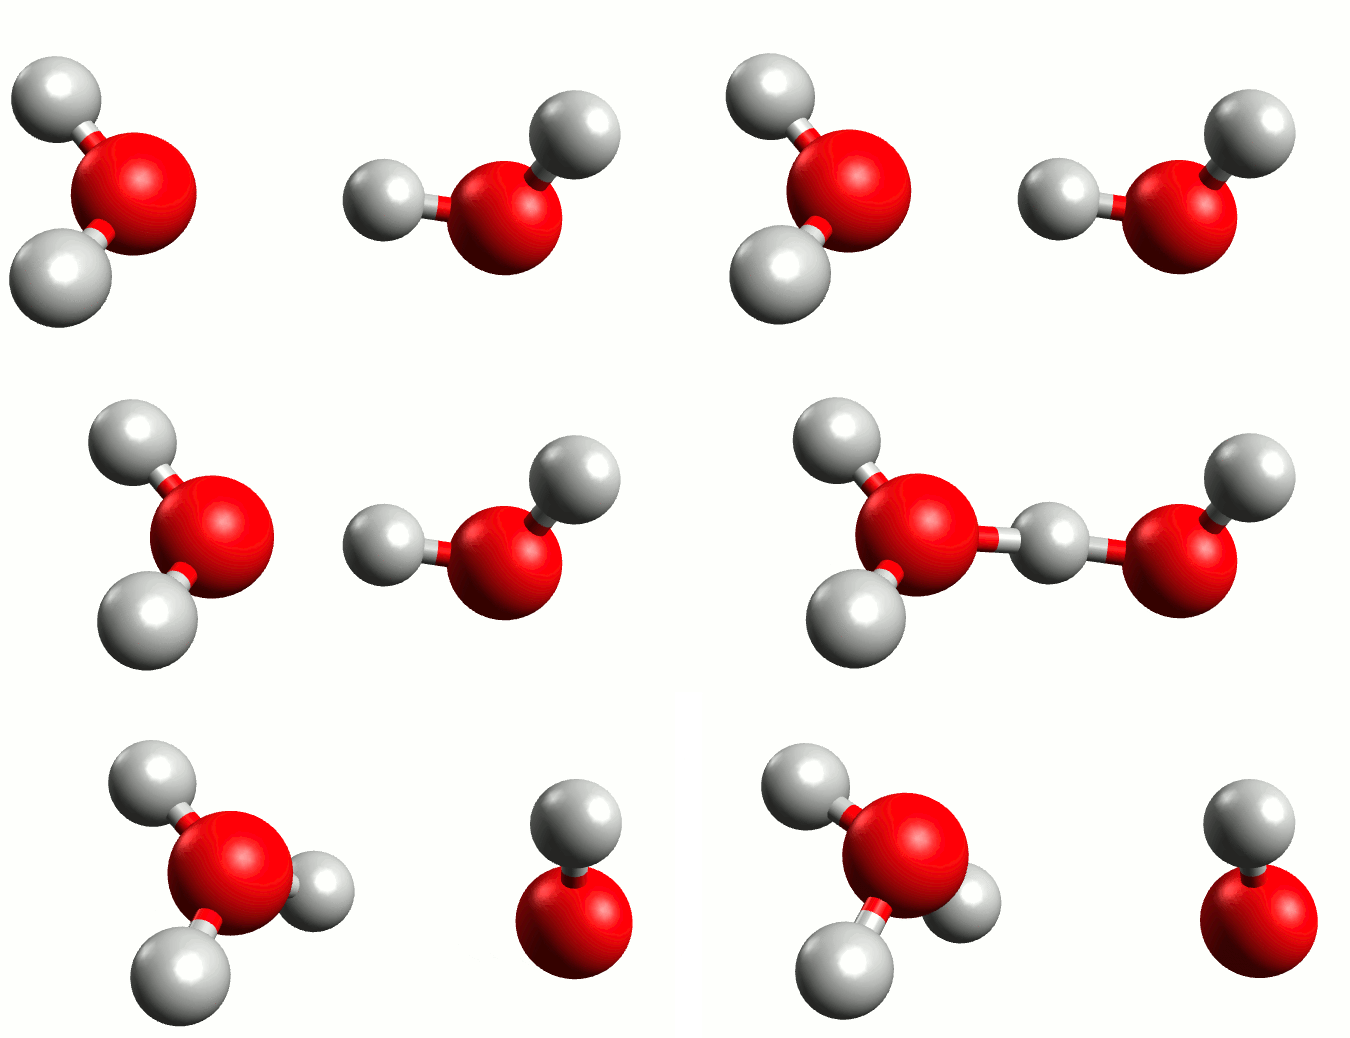
Before moving forward, we must understand one critical definition that will serve as a prerequisite to neatly wrap this derivation up, known as the water ionization constant or the self-ionization of water. The self-ionization of water is an ionization reaction that occurs in pure water or in an aqueous solution, in which H2O loses the nucleus of one of its hydrogen atoms to become a hydroxide ion, OH−.
Now, using the charge balance equation, the [A–] equivalent and the water ionization constant, we can come to the following equation:
 The first two terms present in the equation are not dependent on the buffer in the solution. They represent the fact that the solution of high (or low) pH is resistant to pH changes. This indicates that certain solutions with extremities in pH are resistant to changes, even without a buffer solution present.
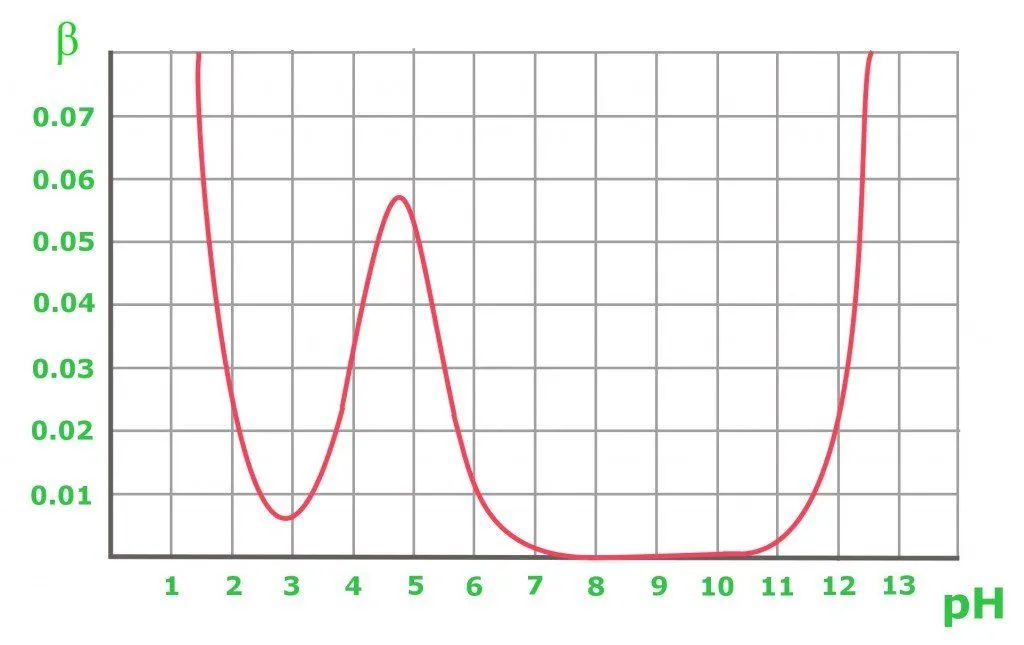 The graph above shows the buffer capacity changes in 0.1 M of an acetic buffer. As expected, the buffer’s resistance to added acid and base peaks when the solution is equimolar in acid and conjugate base (when pH=pKa). From the graph, it is obvious that the buffer capacity has reasonably high values only for pH close to the pKa value: the further from the optimal value, the lower the buffer capacity of the solution. A solution containing a conjugate base of pH 8-10 has a buffer capacity close to zero, while for a higher pH, the presence of the strong base starts to play an important role. In the case of a pure acetic acid solution with a pH below 3, the pH is already low enough to be resistant to changes due to the high concentration of H+ cations.
How Do You Calculate Buffer Capacity? A Worked Example
The derivation above is elegant, but let’s put some actual numbers through it. Picture this: you have 1 liter of an acetate buffer made from 0.10 mol of acetic acid and 0.10 mol of sodium acetate. How much abuse can it take before its pH gives way? There are two ways to find out.
Method 1: Measure it. Add a known amount of strong base, note how far the pH moves, and divide. For a small addition, buffer capacity is simply the moles of base (or acid) added per liter divided by the change in pH:
β ≈ Δn / ΔpH
Acetic acid has a pKa of 4.76 at 25 °C (77 °F), and because the acid and its conjugate base are present in equal amounts, the starting pH is also 4.76. Now add 0.010 mol of sodium hydroxide. The OH– converts 0.010 mol of acetic acid into acetate, leaving 0.090 mol of acid and 0.110 mol of acetate. The Henderson-Hasselbalch equation gives the new pH:
pH = pKa + log([A–]/[HA]) = 4.76 + log(0.110/0.090) = 4.76 + 0.087 ≈ 4.85
The pH moved by just 0.087 units, so β ≈ 0.010 / 0.087 ≈ 0.115 mol per liter per pH unit. Since the definition is moles per liter per unit of pH, that is also the unit buffer capacity is reported in (mol L–1 pH–1). For contrast, the same 0.010 mol of NaOH dissolved in a liter of pure water would drag the pH all the way from 7 to 12.
Method 2: Use the formula. When the pH is well away from the extremes, the [H+] and Kw/[H+] terms in the full equation above become tiny, and only the buffer term survives. This is often called the Van Slyke equation, after the biochemist Donald D. Van Slyke, whose 1922 paper related a buffer’s “buffer value” to its dissociation constant and concentration:
β = 2.303 × C × Ka[H+] / (Ka + [H+])2
Here, C is the total buffer concentration ([HA] + [A–]), which is 0.20 M in our example. The 2.303 is simply ln 10, which sneaks in because pH is a base-10 logarithm. At pH = pKa, Ka equals [H+], so the fraction collapses to 1/4, giving the maximum buffer capacity:
βmax = 2.303 × C / 4 ≈ 0.576 × C = 0.576 × 0.20 ≈ 0.115 mol L–1 pH–1
That matches the answer from Method 1, which is reassuring. (The two agree closely only because our 0.010 mol addition was small; a big dose averages the capacity over a wide pH step.)
Now shift the same buffer to pH 5.76, one unit above its pKa, where acetate outnumbers acetic acid 10 to 1. Plug [H+] = 10–5.76 into the formula and the fraction shrinks from 1/4 to 10/121, so β drops to about 0.038 mol L–1 pH–1, only a third of the peak. The same buffer, with the same amount of material, has lost two-thirds of its muscle.

What Determines Buffer Capacity?
Look closely at the Van Slyke equation and you’ll notice that only two things can change a buffer’s capacity: how much buffer there is, and how that buffer is split between the weak acid and its conjugate base.
- Total concentration. β is directly proportional to C. Double the amounts of weak acid and conjugate base (keeping their ratio fixed) and you double the capacity, while the pH, which depends only on the ratio, stays where it was. This is also why diluting a buffer with water barely nudges its pH but weakens it considerably: a 10-fold dilution of our 0.20 M acetate buffer leaves the pH near 4.76 but cuts βmax from about 0.115 to about 0.0115.
- The acid-to-base ratio. For a given total concentration, capacity is greatest when [HA] = [A–], which is exactly when pH = pKa. A buffer is generally considered effective while the ratio stays between 10:1 and 1:10, which corresponds to the familiar buffer range of pKa ± 1.

The chart above shows the concentration effect in action. It also highlights a distinction that trips up many students: buffer range and buffer capacity are different ideas. The range tells you which pH values a buffer can hold, while the capacity tells you how firmly it holds them. A dilute buffer can sit at precisely the right pH and still cave in after a few drops of acid, like a goalkeeper who is perfectly positioned but only 90 cm (3 ft) tall.
Finally, a buffer that is not sitting at its pKa is lopsided. An acetate-rich buffer has plenty of acetate in reserve to mop up added acid, but relatively little acetic acid left to neutralize added base, so it can absorb far more of one than the other before its pH gives way.
What Is The Buffering Capacity Of Lakes And Soil?
Buffer capacity isn’t just a number from a lab manual. Nature runs enormous buffers of its own, and the difference between a well-buffered landscape and a poorly buffered one became painfully clear during the acid rain crisis.
In most natural freshwater, the dominant buffer is the carbonate system: dissolved carbon dioxide (with a little carbonic acid), bicarbonate (HCO3–) and carbonate (CO32–). Environmental scientists measure a lake’s buffering power as its acid neutralizing capacity (ANC), which the US EPA describes as a measure of the overall buffering capacity of surface waters against acidification. A healthy lake ecosystem typically sits between pH 6.5 and 8.5.

So where does a lake get its capacity? Largely from the ground around it. According to the EPA, soil can buffer acid rain by neutralizing the acidity in the rainwater flowing through it, and this capacity depends on the thickness and composition of the soil and the type of bedrock underneath. Lakes that sit on slow-weathering granite or quartz bedrock, ringed by thin, sandy soils, have little capacity to neutralize acids. That is why mountainous parts of the Northeast United States, where the soil is thin, were among the areas that struggled to neutralize the acid in rainwater. (The same rock-and-soil chemistry explains why some soils are acidic and others alkaline.)
Once that capacity is used up, the pH can fall quickly, and wildlife pays the price. The EPA notes that at pH 5, most fish eggs cannot hatch, and that mayflies may not survive below pH 5.5. One remedy is to top up the buffer directly: acidified lakes have been treated by adding bases such as limestone, lime or sodium bicarbonate, either to the lake itself or to the surrounding watershed.
References (click to expand)
- Buffer Capacity.
- http://web.archive.org/web/20210428020925/https://pharmlabs.unc.edu/labs/ophthalmics/buffers.htm
- CHEM 245: Buffers. Gonzaga University.
- Urbansky, E.T. and Schock, M.R. (2000). Understanding, Deriving, and Computing Buffer Capacity. Journal of Chemical Education, 77(12), 1640.
- Buffer Capacity and Buffer Range. Chemistry LibreTexts.
- Buffer Capacity. Chemistry LibreTexts.
- Van Slyke, D.D. (1922). On the Measurement of Buffer Values and on the Relationship of Buffer Value to the Dissociation Constant of the Buffer and the Concentration and Reaction of the Buffer Solution. Journal of Biological Chemistry, 52, 525-570.
- Acetic Acid. PubChem, National Library of Medicine.
- Effects of Acid Rain. US Environmental Protection Agency.
- Ecosystem Response. Clean Air Markets Progress Reports. US Environmental Protection Agency.
- Acid Precipitation and Remediation of Acid Lakes. CEE 4530, Cornell University.