
Table of Contents (click to expand)
The Phillips curve describes an inverse relationship between inflation and unemployment: in the short run, lower unemployment tends to come with higher inflation. So inflation can pull unemployment down, but only temporarily. In the long run the curve is vertical at the natural rate of unemployment (the NAIRU), so there is no lasting trade-off.
The Phillips curve is an economic theory that has been around for more than half a century. According to this theory, in the short-run, inflation and unemployment follow an inverse relationship. However, in the long haul, this tradeoff between the rate of inflation and unemployment does not hold.
The Phillips curve is therefore one of the most contested economic models in history. There are people for it, and there are others against it. Hailed as “probably the single most important macroeconomic relationship”, what exactly is the Phillips Curve? And by corollary, does inflation really bring down unemployment?
Let’s delve deeper.
Inflation And Unemployment

Inflation is basically an economy-wide price rise. We say that there is inflation if the current prices are higher than the previous year’s prices. Inflation is the difference between the two price levels.
Unemployment is basically joblessness. To be more technical, if someone wants to be employed and is actively looking for a job, but cannot manage to find one, we say that they are unemployed.
Policymakers want to reduce inflation, and they want more people employed at the same time. However, historical data suggests that you can only have one of them. Unemployment often acts as the price of low inflation.
Thus, the association between unemployment and inflation can be explained using the Phillips Curve.
The Phillips Curve
Alban William Phillips was a British economist born in New Zealand. In 1958, Phillips wrote an article in Economica, titled “The Relation between Unemployment and the Rate of Change of Money Wage Rates in the United Kingdom, 1861-1957,” which started this entire discussion. Looking at nearly a century of British data, he found a consistent inverse relationship: when unemployment was low, money wages rose quickly, and when unemployment was high, wages rose slowly. In other words, low unemployment came with faster wage inflation.
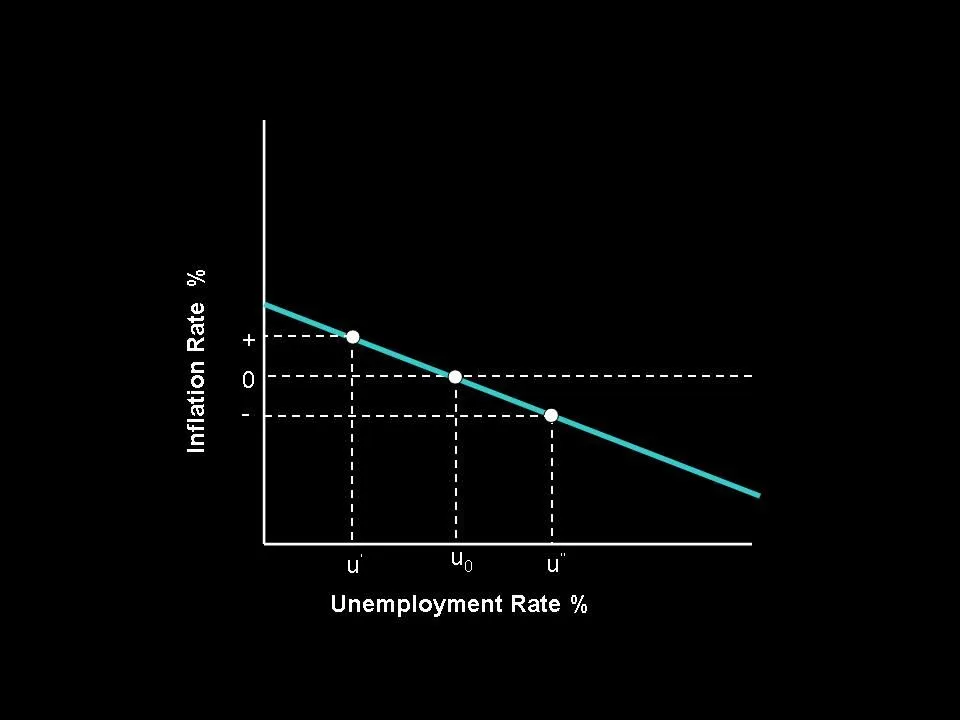
Phillips had studied wage inflation, but in 1960 the American economists Paul Samuelson and Robert Solow adapted his idea for the United States and recast it in terms of price inflation (the everyday price rise we usually mean by “inflation”). They also read the curve as a “menu” of choices, suggesting that policymakers could pick a combination of inflation and unemployment to aim for. That is the modern-day Phillips curve most people have in mind.
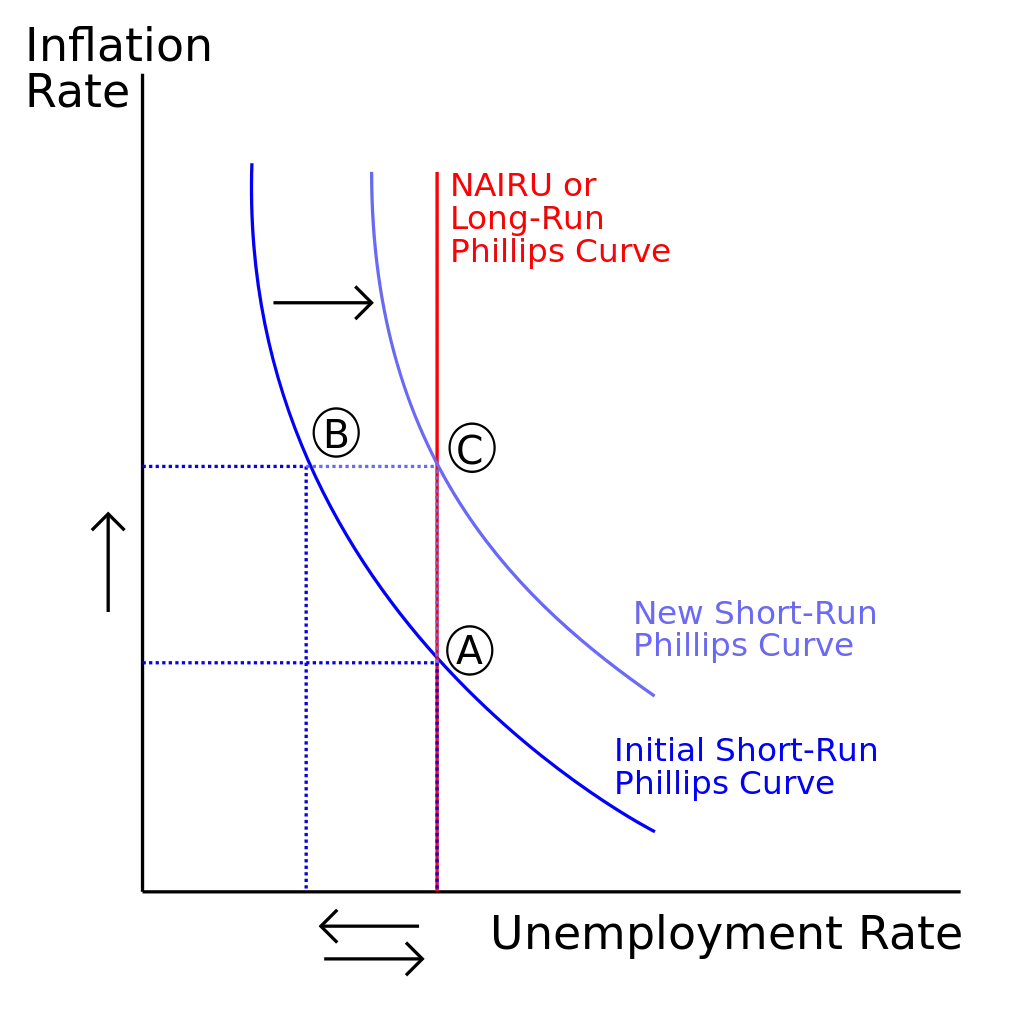
Later economists complicated this neat picture. Milton Friedman and Edmund Phelps argued, independently in the late 1960s, that the trade-off only lasts while inflation catches people by surprise. Once workers and firms come to expect higher inflation and build it into their wage demands, the short-run curve shifts upward, and the trade-off fades. This became known as the expectations-augmented Phillips curve.
How Does The Phillips Curve Work?
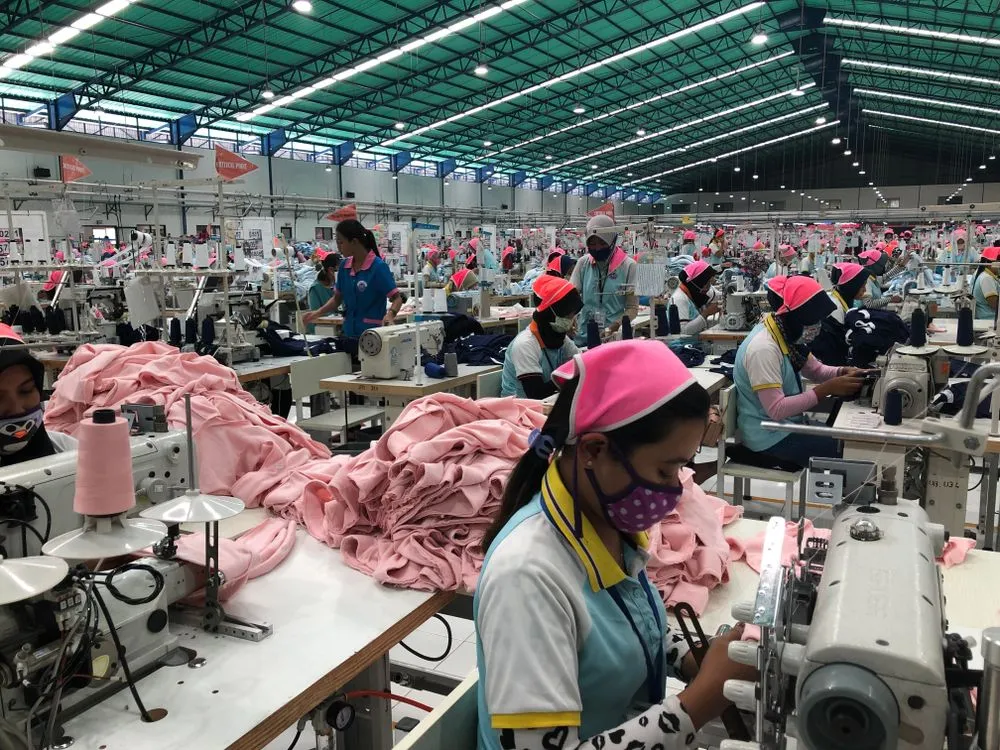
Here is how the Phillips Curve works. Let’s assume that there is inflation in the economy. Since the prices of all commodities are high, firms will look to produce more. Companies would then be able to sell what they make at a higher price (which could hopefully mean a higher profit).
However, in order to expand their output, the companies would need help, so firms across the economy would hire more people. When a lot of firms do this, the unemployment rate falls. Thus, the price rise would lead to more people having a job. Thus, just like the Phillips Curve predicts, higher inflation would mean lower unemployment.
The Long-Run Phillips Curve

However, here’s the catch: the Phillips curve works only in the short run. Over time, people realize that even though the prices of everything they can buy in the economy has increased, their pay hasn’t increased. Therefore, people will push for higher wages so they can keep buying the same things that they’ve always bought. Firms would have no choice but to cave in to the demands of their employees.
This is where things take a turn. When companies pay higher wages, their cost of production increases. Subsequently, producers let some of their workers go, and unemployment would return to its previous level. Unfortunately, the overall prices in the economy or the rate of inflation would remain the same, at the new higher level.
Thus, over a long period, a price rise can’t increase employment, so inflation can only reduce unemployment in the short run.
Through the Phillips Curve, we can see, graphically, how unemployment and inflation move in opposite directions. However, as mentioned, this trade-off only happens in the short run. This is exactly what Friedman and Phelps predicted: in the long run, the Phillips Curve becomes vertical at the economy’s natural rate of unemployment, also called the NAIRU (the non-accelerating inflation rate of unemployment). At that point, pushing inflation higher no longer buys any extra jobs.
Looking At The Data
As Samuelson and Solow suggested, policymakers can try to take advantage of this tradeoff. Firstly, they can choose a combination of inflation and unemployment figures on the Phillips curve. Later, they can use monetary and fiscal policies to try to achieve that desired level.
For instance, in the US, during the 1960s, policymakers managed to increase employment by boosting the money supply and creating an inflationary situation. Since the money supply increased, meaning that people had more money in their hands, the demand for goods and services also surged. A higher aggregate demand spurred an increase in production, and subsequently an increase in employment.
Similarly, in the early 80s, the Federal Reserve under Paul Volcker tried to bring runaway inflation to heel by sharply tightening the money supply. Just as the Phillips curve predicts, this reduced aggregate demand and pushed unemployment up sharply, peaking at nearly 11% in 1982. However, thanks to that rising unemployment, the inflation rate subsequently fell from around 13% in 1980 to roughly 3% by 1983.
In both these cases, the inverse link held. In the first case, higher inflation caused unemployment to fall, and in the second case (the 1980s), higher unemployment pulled down inflation. In other words, during both the 1960s and 1980s, the relationship described by the Phillips Curve held strong.
Conclusion
The Phillips Curve is broadly applicable. It works not just in the US, but also in the other economies around the globe. However, the theory has received its fair share of criticisms as well. The clearest blow came in the 1970s, when the US suffered “stagflation”: high inflation and high unemployment at the same time. The simple Phillips curve said that combination should not exist, yet there it was. That episode is what made the Friedman and Phelps view, with its vertical long-run curve, the new mainstream.
The story did not stop there. Since the 1990s, many economists have argued that the curve has “flattened,” meaning unemployment moves a lot while inflation barely budges. Through the 2010s, US unemployment fell to roughly 3.5% while inflation stayed stubbornly close to 2%, which is why people now ask about a “modern” or “new” Phillips curve. The Federal Reserve credits better-anchored inflation expectations and globalization for this. A paper published by Stock and Watson in 2008 had already flagged the problem, noting that Phillips Curve forecasts are useful but unreliable.
Now, let’s get back to the answer to our original question. Does inflation bring down unemployment?
Yes, to an extent. Terms and conditions apply!
References (click to expand)
- Mankiw N. G. (2009). Macroeconomics. Worth Publishers
- Froyen R. T. (2014). Macroeconomics: Theories and Policies. Pearson
- Stock, J., & Watson, M. (2008). Phillips Curve Inflation Forecasts. National Bureau of Economic Research.
- Phillips, A. W. (1958). The Relation between Unemployment and the Rate of Change of Money Wage Rates in the United Kingdom, 1861-1957. Economica.
- Hoover, K. D. Phillips Curve. The Concise Encyclopedia of Economics. Library of Economics and Liberty.
- Phillips curve. Encyclopaedia Britannica.
- Recession of 1981-82. Federal Reserve History.
- What’s the Phillips Curve and Why Has It Flattened? Federal Reserve Bank of St. Louis.