Economists predict a recession by watching leading indicators that turn down before the wider economy does. The most-watched are an inverted Treasury yield curve, a falling Conference Board Leading Economic Index, and the Sahm Rule, which flags a recession when the three-month average unemployment rate rises 0.5 points above its prior 12-month low. None is perfect, so forecasters track them together.
A teacher running a classroom or a software engineer working for a company counts as an economic activity. So does any other legal activity for which a person is paid a wage or a fee once it is done. Note that an illegal exchange, say money handed over for drugs, does not count as an economic activity, precisely because it is illegal.
Income earned through such an exchange will never be accounted for when a country calculates their GDP, as the earner will definitely not show it as their income!
Economic activity worldwide is primarily measured by a framework set by the International Labor Organization (ILO). Countries have adopted statistical systems worldwide based on the industrial activity classification provided by the ILO. The classification tries to represent the aggregate activity within an economy as accurately as possible; hence it’s updated periodically.
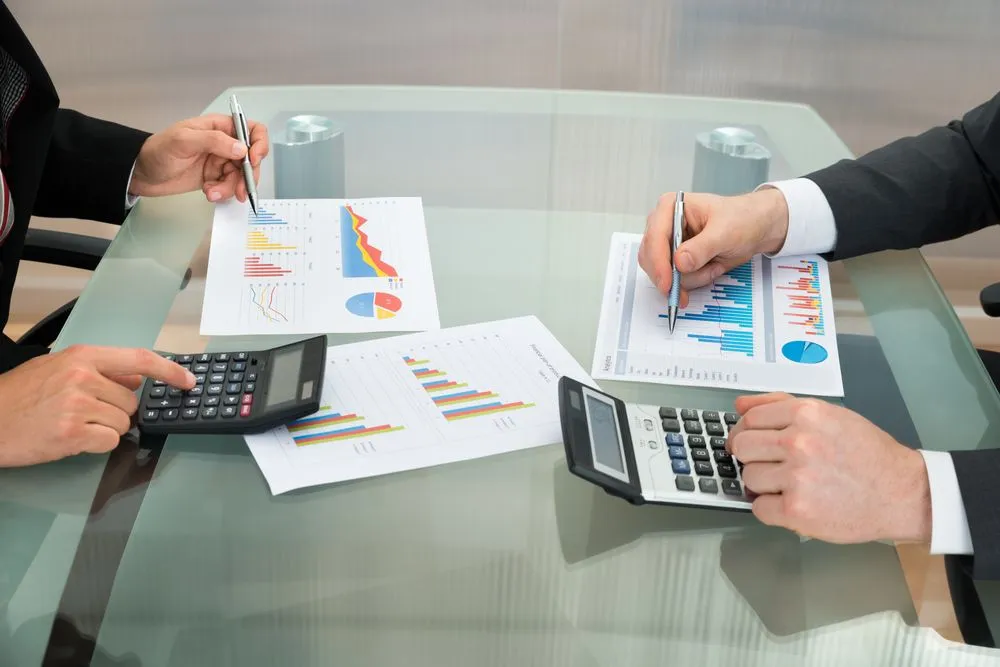
A country must track their economic activity, as these activities generate income or GDP for a country. Classifying these activities provides insight into which activities are broadly contributing to a nation’s income. Awareness of this level of information helps policymakers design interventions that shape the country’s development.
Now, this economic activity is bound to experience fluctuations for multiple reasons, including shocks caused by natural disasters or economic recessions and booms due to technical innovation or the discovery of natural resources. Therefore, it is equally essential that a country tracks its activities’ movements over time. This is done through business cycles.
What Do Business Cycles Look Like?
The cyclical fluctuations of upswings and downswings that an economy experiences due to fluctuations in its real GDP, employment, income and sales is called a business cycle.
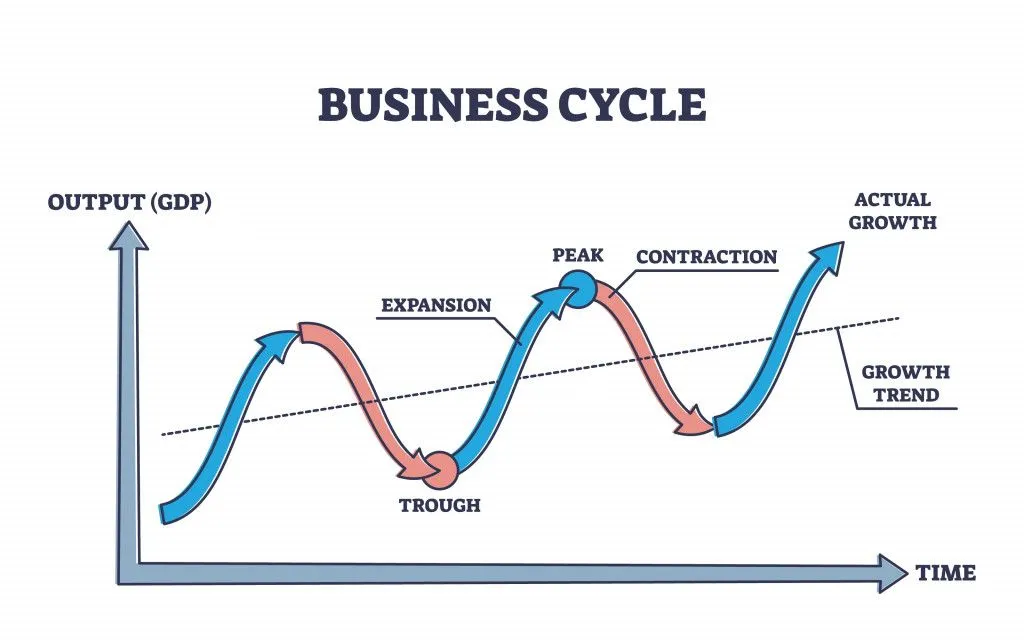
The upper tipping point of the curve is known as the peak. This represents that point for an economy when the GDP peaks. The economy cannot stay here for an extended period, as it is unsustainable. The peak is where aggregate demand in the economy usually surpasses aggregate supply, resulting in prices rising (inflation), as the current supply cannot cater to the existing demand.
On the flip side, it is also the point where unemployment is extremely low, as suppliers are hiring as much labor as possible to cater to this demand. This situation cannot persist; it is a bubble. This is why it is immediately followed by a recession. Mind you, an expansion can also be powered by a wave of technical invention, like the steam engine, which helped fuel decades of British economic growth from the 1780s onward.
Following such a peak, an economy usually cools off. A recession is generally defined as the period between a peak and a trough. You have probably heard the popular rule of thumb that a recession means two consecutive quarters of falling real GDP, but that is not the official definition. The NBER, which dates US recessions, deliberately avoids that fixed rule and weighs several indicators instead. Most recessions do feature two down quarters, yet not all do, the 2001 recession did not.
Again, these are not cyclical; one cannot accurately predict them, as events can also be random. For instance, the COVID-19 pandemic caused an unprecedented worldwide recession.
Expansion is usually said to be the normal state of an economy. An economy is led in this direction by the government and a country’s central bank through policy intervention via taxes and interest rates, as required.
Tracking The Cycle: When Is It Called A Recession?
Economists worldwide have struggled to accurately predict when a recession will commence and end. In the US, it is the role of the National Bureau of Economic Research (NBER) to identify the dates of the four points in a business cycle: peak, contraction, trough and expansion.
Since the Committee’s formation in 1978, it has confirmed each turning point only well after the fact. The lag between a peak and its announcement has run from about 4 to 12 months, while troughs have taken even longer to call, between roughly 8 and 21 months. In other words, by the time the NBER officially says a recession has begun, you are usually already living through it.
The exact time an economy takes to move from a peak to a trough and back again varies from one cycle to the next. The NBER spells out its dating procedure and the reasons for these delays in detail: it waits for revised, reliable data so it rarely has to revise a turning point later.
For the NBER, the severity of a recession takes three criteria into account: depth, diffusion and duration. Similarly, the strength of an expansion falls under another set of three criteria: pronounced, pervasive and persistent. Each of these criteria has its respective indicators.
The depth of any period is measured by how these criteria are individually affected. Sometimes, the effect of a criterion could also overpower the rest and lead to a recession or an expansion. However, the NBER broadly looks at a basket of monthly measures: real personal income less government transfers, nonfarm payroll employment, household-survey employment, real consumer spending, manufacturing and trade sales, and industrial production. There is no fixed formula for how the Committee weighs this information when making its decision.
According to the NBER, the most recent peak occurred in February 2020. The most recent trough occurred in April 2020. Between February and April, the US economy did experience a recession. These 2 months of recession are the shortest on record. The pervasiveness of a recession will only be confirmed if it is corroborated with similar data from other indicators above.
So How Do Economists Actually Predict A Recession?
Here is the catch. Everything above is backward-looking. The NBER tells you a recession happened, often a year or more after the fact. So if economists cannot officially call a recession until it is well underway, how does anyone see one coming? The answer is that they lean on leading indicators, measures that tend to turn down before the broader economy does. No single one is a crystal ball, so forecasters watch several at once.
The most famous is the inverted yield curve. Normally, lending the government money for 10 years pays a higher interest rate than lending it for three months, because you are tying up your cash for longer. When that flips, when short-term Treasury yields rise above long-term ones, it usually means investors expect the central bank to cut rates soon to rescue a slowing economy. The Federal Reserve Bank of New York runs a model, built by economists Arturo Estrella and Frederic Mishkin, that turns the gap between the 10-year and 3-month Treasury yields into a probability of recession over the next 12 months. An inverted curve has preceded essentially every US recession since the 1970s, though the lead time can be anywhere from 6 to 24 months, and the occasional false alarm does slip through.
A second tool is the Conference Board Leading Economic Index (LEI), a single number that bundles together ten forward-looking ingredients, including new orders for manufacturers, building permits, stock prices, consumer expectations and the yield-curve spread itself. When the LEI falls sharply and steadily for several months, it has historically flagged a coming downturn well ahead of the GDP figures.
A newer favorite is the Sahm Rule, named after economist Claudia Sahm. It is refreshingly simple: a recession is likely underway once the three-month average of the US unemployment rate climbs at least 0.5 percentage points above its lowest point in the previous 12 months. Because it relies only on the monthly jobs report, it works in close to real time, and it has lit up at the start of every US recession since 1970 with just one near-miss. It is less a long-range forecast than an early warning that the turn has already begun.
Put these together, the yield curve, the LEI and the Sahm Rule, and you have the toolkit most economists actually reach for when someone asks whether a recession is around the corner. They will rarely give you a confident yes or no, because, as you will see next, even the idea of a business cycle is contested.
Subjectivity In Cycles
Not only is the point of occurrence subjective, but the idea of a business cycle is also driven by contrasting ideas from various schools of economic thought.
For instance, economist Joseph Schumpeter does not entirely believe that the cycle results from fluctuations in demand and supply for capitalist economies. While an economy would tend to reach its optimal point where supply catches up to demand, he still believes that the propeller for change was innovation.
Khan Academy has also tracked how emotions play out during a business cycle!
Notice the emotional high during the period of expansion that peaks at euphoria. Contrast these emotions with the slow fall into a recession that ends in depression. The emotional driver from the depression onwards lies mainly with the policies initiated by the government during this period. This is also why we see hope as the starting point for the next cycle!
References (click to expand)
- International Standard Industrial Classification of ... - ILOSTAT. The International Labour Organization
- Business Cycle Dating Procedure: Frequently Asked Questions. The National Bureau of Economic Research
- The Yield Curve as a Leading Indicator. Federal Reserve Bank of New York
- US Leading Economic Index. The Conference Board
- Sahm Rule Recession Indicator. Britannica Money
- Joseph A. Schumpeter, 1883-1950.. hetwebsite.net
- The business cycle (video) - Khan Academy. Khan Academy