Table of Contents (click to expand)
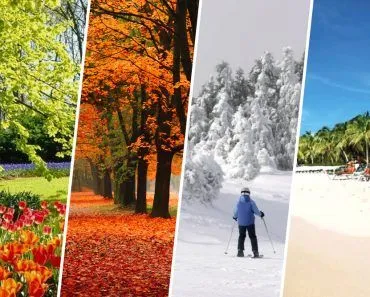
Yes, gas concentrations in Earth's atmosphere shift with the seasons. The biggest swing is in carbon dioxide: northern-hemisphere plants pull about 6 ppm of CO2 out of the air each spring and summer through photosynthesis, then return it through decay and respiration in fall and winter. Oxygen, methane and nitrous oxide rise and fall in step, but far less.
When most people hear the word “atmosphere”, they think of the thin bubble of air enveloping our planet, the realm of clouds and airplanes and satellites. However, in recent years, a great deal more focus has fallen on the atmosphere and its constituent parts, particularly greenhouse gases, due to their direct impact on climate change and global warming. This concern over greenhouse gas concentrations in the atmosphere, and the increase in climatic events in various seasons, has led to many new questions about the impact of seasons on our planet. More specifically, do the concentrations of different gases change based on the seasons?
Atmospheric Composition
For those that don’t know, the reason that life has been able to survive and flourish on this planet is because our planet retains a consistent atmosphere, unlike our celestial neighbors like the moon and Mars. This atmosphere, as described above, is an extremely thin envelope surrounding our planet that contains oxygen, nitrogen, argon, carbon dioxide, ozone and various other gases in very trace amounts. This is the atmospheric stew of life that enables every organism on Earth to respire and photosynthesize.
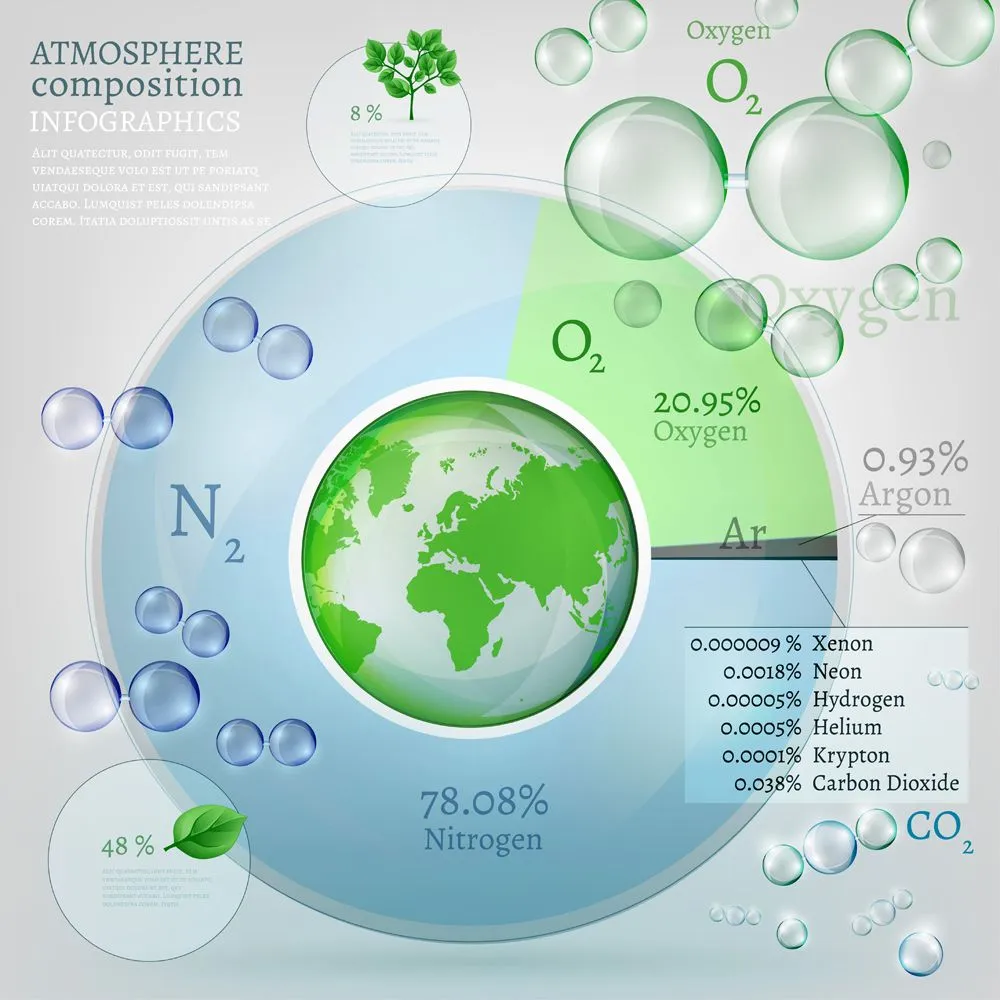
By concentration, dry air is composed of roughly 78.1% nitrogen, 20.9% oxygen and 0.93% argon. On a smaller scale, carbon dioxide is now around 0.043% (about 425 parts per million, ppm), methane makes up about 0.0002% (1.9 ppm), and ozone is even rarer (a few tenths of a ppm averaged through the whole atmosphere, with a peak of about 10 ppm in the stratospheric ozone layer). Despite making up far less than 1% of the atmosphere combined, these last three gases receive a huge amount of attention, as they are greenhouse gases and contribute to the rise in global temperature. It makes sense, therefore, to ask whether their concentrations change over the course of the year based on seasonal weather and location.
It is important to remember that the atmosphere on Earth is generally considered to be “well-mixed” below the stratosphere, in the sense that gases in the atmosphere spread out and equalize (under perfect conditions). For scale, Earth's mean radius is about 6,371 km (3,959 miles), and the atmosphere fades gradually into space, with the conventional edge (the Kármán line) sitting just 100 km (62 miles) up. That being said, roughly three-quarters of the atmosphere's mass is packed into the troposphere, the first 10 to 12 km (about 6 to 7 miles) above the surface; beyond that point, the air becomes incredibly thin and cold, and is not suitable for breathing like the air nearer to the surface. The molecules near the surface are held there by the force of gravity, with heavier molecules generally found at lower altitudes.
In terms of lateral movement, i.e., clouds and wind moving the atmospheric constituents around, there are some natural phenomena that can inhibit this, such as stagnant air areas. With a lack of wind and low/light precipitation, a buildup of particulate matter can form in a small region that isn’t regularly having its atmosphere flushed and moved. Generally speaking, the concentration of the atmospheric gases and particulate matter in a given place is dependent on the outside factors affecting it, i.e., proximity to industrial power plants vs. natural forests, density of vegetation, altitude, location within natural pressure belts, etc.
Seasonal Changes
The majority of plant matter on Earth is found in the northern hemisphere, which is an important fact to consider when thinking about seasonal changes in the atmosphere. During the fall and winter months, which generally run from October through March, leaves fall to the ground and plants generally decay, releasing their carbon dioxide back into the atmosphere. However, during the spring and summer months, plants are rejuvenating themselves and growing, taking in carbon dioxide from the atmosphere to produce their “food” and generating oxygen as a byproduct.
Therefore, in the American Northeast, for example, a heavily wooded region, the oxygen concentration in the atmosphere may drop slightly in the fall and winter, while the carbon dioxide percentage will rise. In the spring and summer, these figures will reverse, as more oxygen is pumped out by tens of millions of trees, and carbon dioxide is greedily vacuumed up. By the numbers, the Keeling Curve at Mauna Loa shows an annual CO2 peak-to-trough swing of about 6 ppm (roughly 1.4% of the background concentration), and that swing climbs to 15-20 ppm at high northern latitudes like Barrow, Alaska. Oxygen, present in far higher concentration, has a much smaller annual cycle of about 28 ppm, or roughly 0.013% of total O2.
Carbon dioxide and oxygen levels are often affected by massive seasonal events, such as the wildfires that have repeatedly swept through the American West, Canada, Australia and the Amazon region in recent years (the 2023 Canadian wildfire season alone released roughly 3 billion tonnes of CO2, several times Canada's annual fossil-fuel output). These blazes significantly increase carbon dioxide levels in the air, and most commonly happen during the late spring and summer. Weather patterns also change by season, however, based on the tilt of the Earth and the temperature of different regions. The same pressure belts that move air around the planet during the winter may not have the same effect during the summer. Therefore, when unique atmospheric compositions form, they may be unable to dissipate if they’re blocked by stagnant air systems or geographic obstacles (e.g., mountains). The jet stream, regional weather systems, and large-scale atmospheric trends are not an exact science, resulting in a somewhat patchy distribution of carbon dioxide concentrations around the globe.
Aside from carbon dioxide and oxygen fluctuations, methane levels may also vary based on geographic location. Areas where there is significant livestock rearing, rice paddy cultivation, coal mining, landfills, and oil and gas extraction may experience higher atmospheric levels of methane during those industries’ most active seasons. Nitrous oxide is similar to methane in this way, and is generated when fuel or biomass is burned, or through the use of nitrate and ammonium fertilizers. In certain seasons, when these activities are more common, regions may see small shifts in their overall atmospheric concentrations.
The dissipation and balancing of atmospheric constituents is not an immediate process (if it happens at all), so seasonal fluctuations are normal and expected. That being said, experts can monitor these changes in seasonal concentration to identify larger trends related to climate change and mitigation efforts.
A Final Word
Breathing is something that most of us take for granted every instant of the day, but every breath we take is part of a dynamic and global system of gaseous distribution. The air you breathe in the summer will be minutely different than a gulp of air taken in the bitter winter. Inhaling in the center of the Sahara will be quite different than huffing and puffing at the heart of an industrial city butted up against a mountain range. Like so many other systems and cycles on this planet, the atmosphere is reactive and adaptive, working hard to keep humanity alive, despite our unsustainable and destructive practices!
References (click to expand)
- Layers of Earth's Atmosphere - UCAR Center for Science Education
- Seasonal Changes in Carbon Dioxide - SVS. The National Aeronautics and Space Administration
- Global Patterns of Carbon Dioxide - NASA Earth Observatory
- Trends in Atmospheric Carbon Dioxide - NOAA Global Monitoring Laboratory
- Trends in Atmospheric Methane - NOAA Global Monitoring Laboratory
- Why are Seasonal CO2 Fluctuations Strongest at Northern Latitudes? - The Keeling Curve, Scripps Institution of Oceanography
- Atmospheric Composition - tornado.sfsu.edu