
Scientists study earthquakes through seismology, using networks of seismographs that record the squiggly traces (seismograms) of P-waves and S-waves passing through the ground. By measuring the time gap between P and S arrivals at three or more stations and triangulating, seismologists pinpoint the earthquake's epicenter, while the moment magnitude scale (which replaced the Richter scale for large quakes) gives its size.
Earthquakes are caused when stress built up between or within tectonic plates is released as the rock suddenly slips, sending shockwaves outward through the ground. The slip can happen at plate boundaries (the most common case) or within plates. The plane where they slide is called the fault. The science of understanding earthquakes is known as seismology. Scientists who specialize in seismology are called seismologists.
The energy of an earthquake is carried by seismic waves, which are vibrations that travel through the planet. Seismometers are instruments that scientists use to analyze seismic waves. As seismic waves pass through, it records them as jagged patterns. The data of these patterns is called a seismogram. Seismometers are often used interchangeably with seismographs.
Basics Of Seismics
Three separate sets of waves depart from the focus of the earthquake. Primary waves, or P-waves, are the initial waves to arrive. S waves, or secondary waves, come next. They both move through the interior of the Earth. Surface waves move through the surface of the Earth and get detected last.
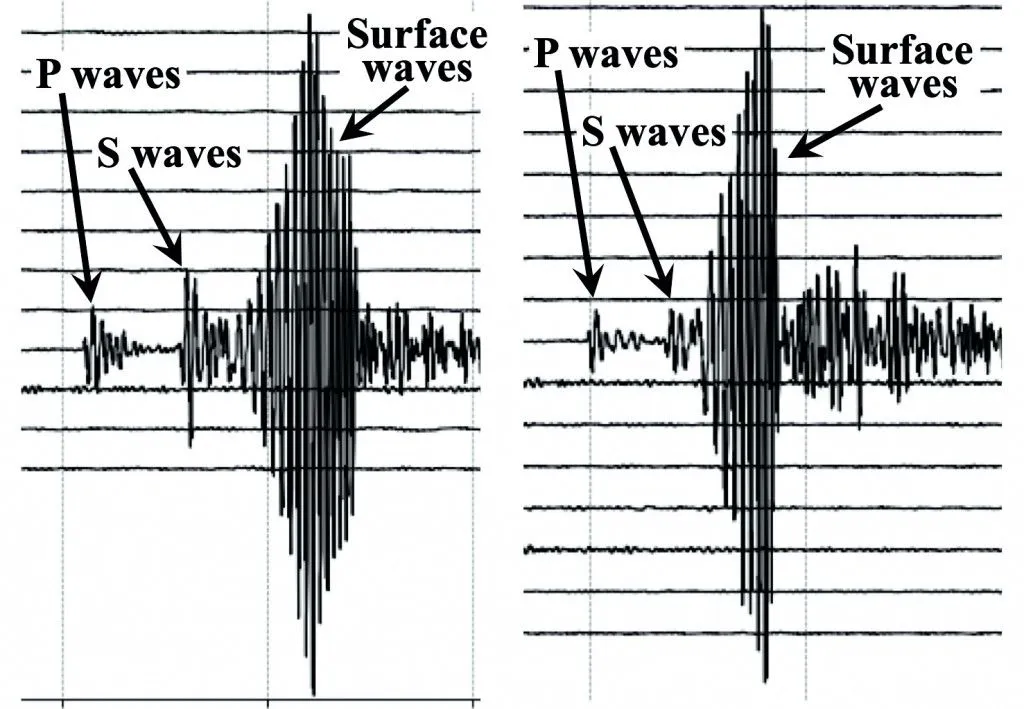
P-waves are compressional waves. They move by pushing or pulling particles in the direction of propagation. S-waves are shear waves. They displace the particles of matter perpendicular to their direction of motion. S-waves move at a velocity roughly 60% that of P-waves (the P/S ratio is about √3, near 1.73 in typical rock). P-waves move faster than S-waves through solids because compressional waves depend on both the bulk and shear stiffness of the material, while shear waves depend only on the shear stiffness, so P-waves are stiffer and faster. This is why P-waves are detected by the seismographs before S-waves.
Surface waves are limited to the Earth’s surface and outer layers. They move at a somewhat slower speed than S-waves. These last waves cause the earth to roll or tremble sideways. Surface waves are the most destructive, in terms of their direct impact on the surface environment.
How Do Seismographs Work?
Without seismographs, seismology would be impossible! Seismographs are the primary tool used by seismologists because they allow the collection of Earth’s vibrational data. Seismographs used to record data on paper, but the use of analogue equipment is declining. Today, digital instruments are favored. They provide a more accurate reading and allow for clearer descriptions of ground vibrations.
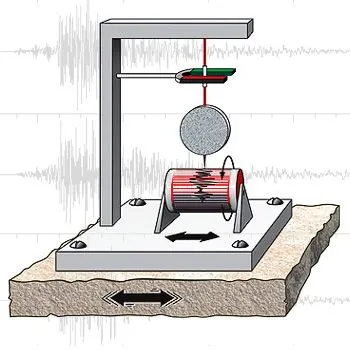
The foundation of a seismograph is firmly embedded in the surface, and the mass hangs freely. An earthquake causes the base of the seismograph to vibrate, but the hanging mass remains unaffected. Instead, the string it is suspended from absorbs all the motion. The positional difference between the seismograph's shaking base and its stationary suspended mass is recorded as the seismogram, the squiggly trace people associate with earthquakes. This helps to measure the movement of the ground brought on by seismic waves.
How Do They Locate The Focus?
The time difference between the appearance of the P-waves and S-waves is determined by how far they have travelled from the focus (or hypocenter), the underground point where the rupture begins. The larger the delay, the farther the waves have gone. To precisely measure the appearance of seismic waves from earthquakes at known locations, seismologists have built webs of sensitive seismographs across the world.
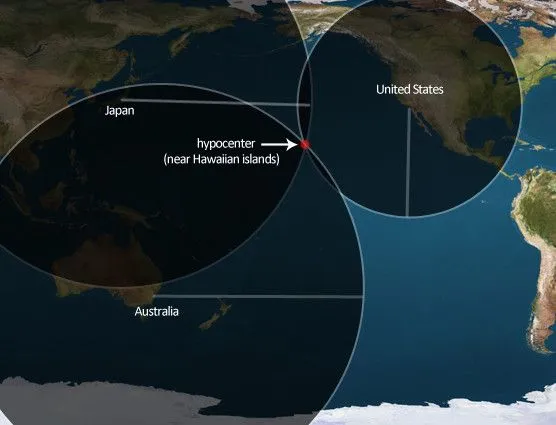
The gap in the arrival of the P-waves and S-waves on a seismogram can only be used to determine how distant the quake was from the recorded site, but not its direction. A circle with a radius equivalent to the predicted distance to the earthquake can be drawn around the station on a map to identify candidate locations for the epicenter, the point on the Earth's surface directly above the focus. Scientists then apply a technique known as triangulation, which requires at least three seismographs. The epicenter is the point at which readings from the three separate seismographs connect on a map.
Measuring The Size Of Earthquakes
The Richter scale, developed by Charles F. Richter in 1934, was the first widely applied method to quantify earthquake strength. It was calculated using a formula that took into account the distance between the seismic event and the measuring tool, as well as the magnitude of the largest pulse ever captured on a certain type of seismometer.
If the maximum amplitude of the seismic activity produced by two earthquakes located at the same range from a seismograph differs by a factor of 10, they vary on the Richter scale by one magnitude unit. Therefore, a magnitude 3 earthquake causes 10 times the amount of ground displacement as a magnitude 2 earthquake.
However, the Richter scale cannot give precise estimations for earthquakes of great magnitude. The moment magnitude scale is favored these days. The moment generated by an earthquake is a function of the fault’s movement’s distance and the force needed to move it. It is produced from earthquake records made at various places using modeling. The only scale that can reliably measure occurrences with a magnitude of M8 or higher is the moment scale.
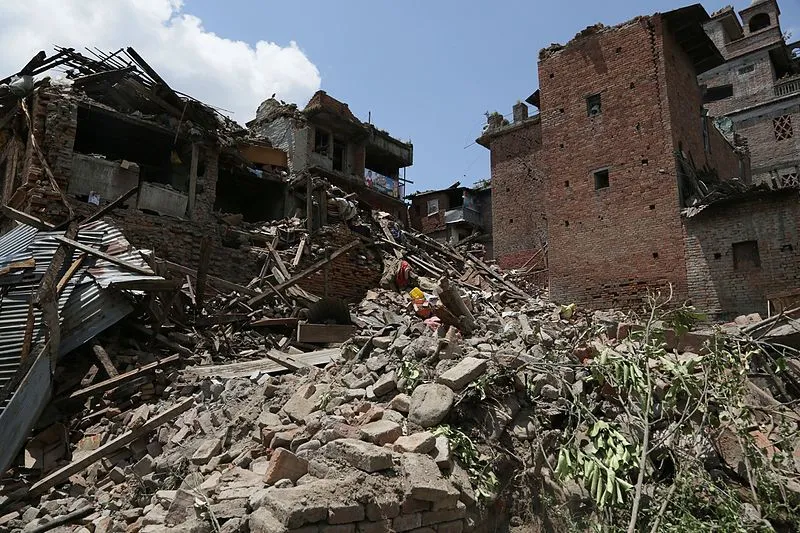
Nearly 750,000 people died from earthquakes worldwide between 1998 and 2017 per the World Health Organization, representing over half of all casualties from natural catastrophes. The toll has continued in recent years, with the February 2023 Turkey-Syria earthquake (magnitude 7.8) killing roughly 60,000 people and the January 2024 Noto Peninsula earthquake in Japan (magnitude 7.6) claiming hundreds more. We have long worked to increase our capacity to anticipate where and when earthquake events may occur and our comprehension of what follows when they do to deal with the death and damage they cause.
Although we still cannot reliably predict when huge earthquakes will occur, we can take precautions to lessen their devastation. Modern earthquake early warning systems like the USGS-led ShakeAlert on the US West Coast, Japan's EEW network (the longest-running of its kind), and Mexico's SASMEX detect the faster, less-damaging P-waves at the rupture and send out alerts seconds to tens of seconds before the destructive S-waves and surface waves arrive — just enough time for trains to brake, gas valves to shut, and people to take cover. We can also work with professionals to create projects, dams, bridges, and other buildings that can sustain seismic shaking, use our geologic expertise to locate areas where large earthquakes are more likely to occur, and support vulnerable populations to prepare for seismic catastrophes and respond to them in the safest possible way.
Magnitude Vs. Intensity: Why Earthquakes Get Two Different Scores
Magnitude only tells you how much energy an earthquake released at its source. It says nothing about what any particular person actually experienced. Two people 50 miles (80 km) apart during the same quake can have completely different stories, one whose bookshelf toppled over, another who barely noticed the floor tremble. That gap is captured by a separate number entirely: the Modified Mercalli Intensity (MMI) scale.
Unlike magnitude, which comes straight off a seismometer and a formula, Mercalli intensity is built from what people felt and what a damage survey finds on the ground. It traces back to Italian volcanologist Giuseppe Mercalli, who published an earlier version of the scale in 1902. American seismologists Harry Wood and Frank Neumann revised it into the Modified Mercalli scale in 1931, updating it to account for modern features like tall buildings, automobiles, and underground utility lines.
The scale runs from Roman numeral I to XII instead of a mathematical value. At the low end, the shaking is so faint that few people notice it at all. In the middle of the range, people wake up, hanging objects swing, and dishes rattle off shelves. Structural engineers typically get involved once the intensity reaches VIII or higher, where the numbers track increasingly serious building damage, up through XII, where the shaking is total and objects are thrown into the air.
Because intensity depends on distance from the epicenter, local ground conditions (soft sediment shakes far more violently than solid bedrock), and how well nearby buildings were constructed, a single earthquake produces one magnitude but an entire map of different intensity values, a separate one for every place it was felt. After a significant quake, the USGS “Did You Feel It?” program crowdsources exactly this kind of on-the-ground reporting from residents, turning their answers into a detailed shaking-intensity map within minutes, since seismometers alone cannot capture how unevenly a quake behaves across a city or region.
For emergency responders deciding where to send help first, intensity is often more useful than magnitude. A moderate magnitude 5.5 earthquake centered under a densely built, poorly constructed neighborhood can register a higher Mercalli intensity there, and cause more real-world damage, than a magnitude 7 earthquake whose epicenter sits deep underground in a sparsely populated area.
References (click to expand)
- How Are Earthquakes Studied? | UPSeis | Michigan Tech. Michigan Technological University
- The Science of Earthquakes | U.S. Geological Survey. The United States Geological Survey
- What Is an Earthquake? | NASA Space Place. The National Aeronautics and Space Administration
- Earthquake Magnitude, Energy Release, and Shaking Intensity. The United States Geological Survey
- How Do We Measure Earthquake Magnitude? | UPSeis. Michigan Technological University
- The Modified Mercalli Intensity Scale. The United States Geological Survey
- Did You Feel It?. The United States Geological Survey


