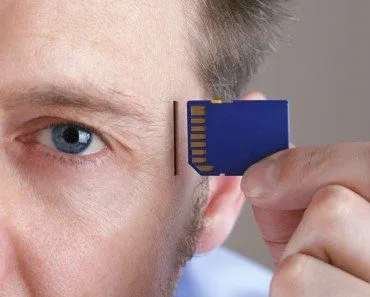
Brain imaging works by detecting either the brain's structure or its activity. CT and MRI map structure, while fMRI tracks blood oxygenation, PET measures metabolic activity over time, and EEG records electrical activity in milliseconds. These are non-invasive techniques used to study how the brain functions and to spot abnormalities.
We humans are curious beings. We’re constantly tinkering, trying to decipher what’s going on inside everything around us (and within us!). To continue learning, we’ve sent probes into space to monitor different planets, and we’ve sent probes into the rectum. Basically, we pull, push and tear things apart to discover everything we can about them.
Yet, technology has found itself at a standstill when it comes to finding ways to interrogate the most enigmatic and impenetrable part of our body: the brain. Woven from billions of neurons, the brain lies snug beneath layers of protective tissues, secured by the robust coverage of the skull.
The most we can do to examine this intrinsic part of our being is to capture its image by passing different electromagnetic waves through it.
You might be familiar with various brain imaging methods like EEG, fMRI, and PET scans, but how do they work?
fMRI: Functional Magnetic Resonance Imaging
To understand where the neuronal signals are coming from, we need Functional Magnetic Resonance Imaging or fMRI. Unlike an EEG, fMRI does not measure the electrical impulses sent by the neurons, but rather records changes associated with the blood oxygenation in the brain.
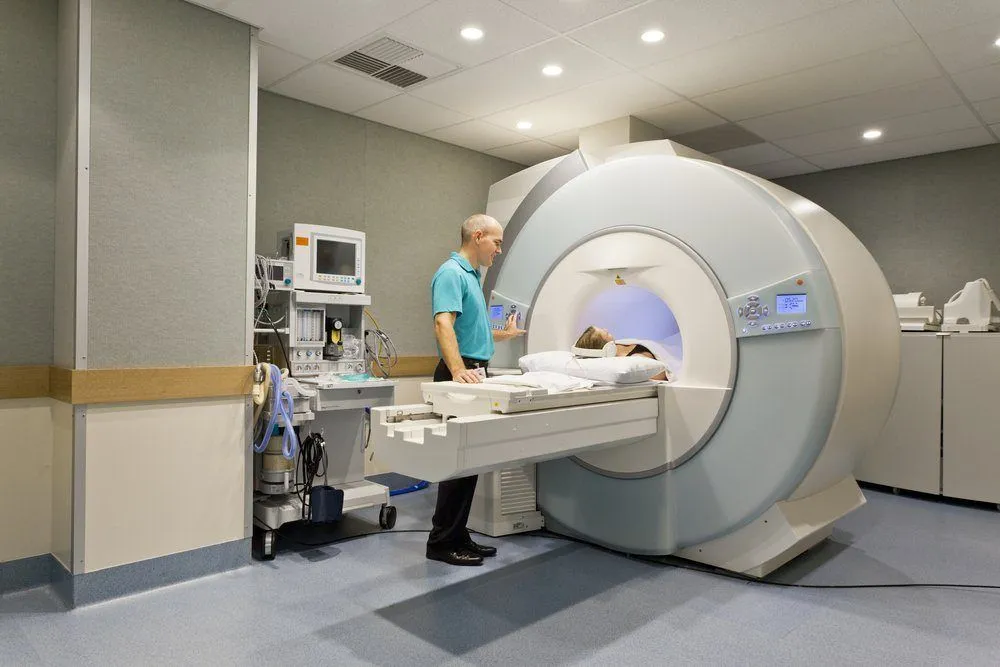
When neuronal activity in the brain increases, the oxygen demand also surges. In response, there is an increase in the flow of blood containing oxygen-rich hemoglobin to the brain.
An fMRI draws on the difference between the magnetic property of oxygenated and deoxygenated blood to create a map of the brain’s neuronal activity.
All molecules exhibit magnetic resonance as they move in an external magnetic field such as the one created by the fMRI machine. Radio signals are sent by the machine using a radiofrequency pulse, and the signal after ‘tipping’ the molecules are sent back to the receiver in the machine.
Oxygenated blood or oxyhemoglobin is diamagnetic (they repel from magnetic field). Meanwhile, deoxygenated blood or deoxyhemoglobin is paramagnetic (they are weakly attracted by magnetic fields).
Deoxygenated blood causes more disruption in the local magnetic field than oxygenated blood, owing to its paramagnetic nature. When carrying out a specific task, the neuronal signaling increases in the corresponding region of the brain and receives increased levels of oxygenated blood.
Since oxyhemoglobin does not disrupt the local magnetic field, the fMRI can easily pick up on the changes in oxygenation which is then extrapolated to neuronal activity. It can pinpoint active areas of the brain with a 5mm accuracy.
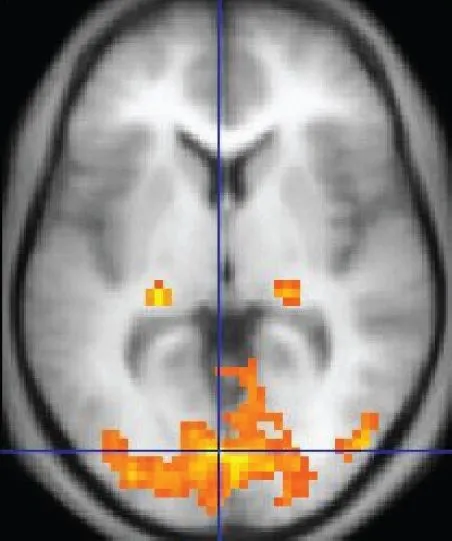
fMRI can tell us which part of the brain is involved in various functions and study the effects of brain abnormalities, such as strokes or dementia.
PET Scan: Positron Emission Tomography
A Positron Emission Tomography (PET) scan is another non-invasive brain imaging technique. It measures the metabolic activity of cells in the body, including the brain. A PET scan requires the introduction of a short-lived positron-emitting radioactive material known as radiotracer into the brain.
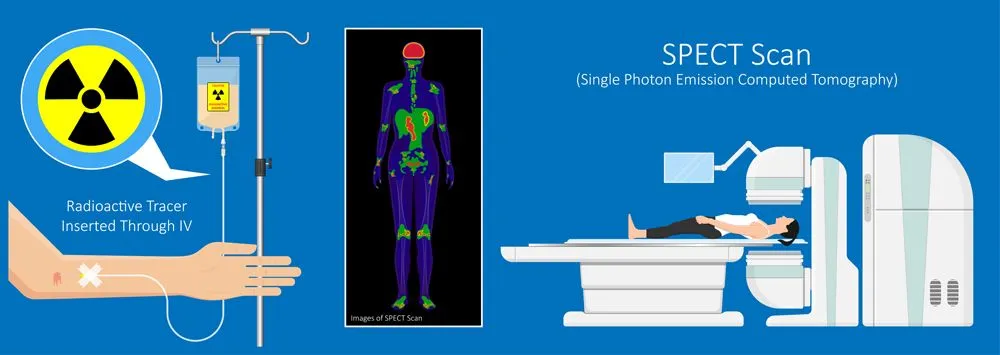
Fluorodeoxyglucose (FDG) is a common radiotracer used in PET scans. It is preferred because the body treats it similar to the naturally available glucose used by the brain for metabolism. For example, a PET scan can detect brain tumors using FDG, as cancerous brain cells consume glucose faster than normal cells.
Once the tracer is injected into a peripheral vein and reaches the brain, it undergoes radioactive decay, releasing positrons. These are positively-charged subatomic particles similar to electrons, but with the opposite charge. When a positron collides with an electron at high speed, they annihilate each other. This annihilation of subatomic particles releases two gamma rays in opposite directions.
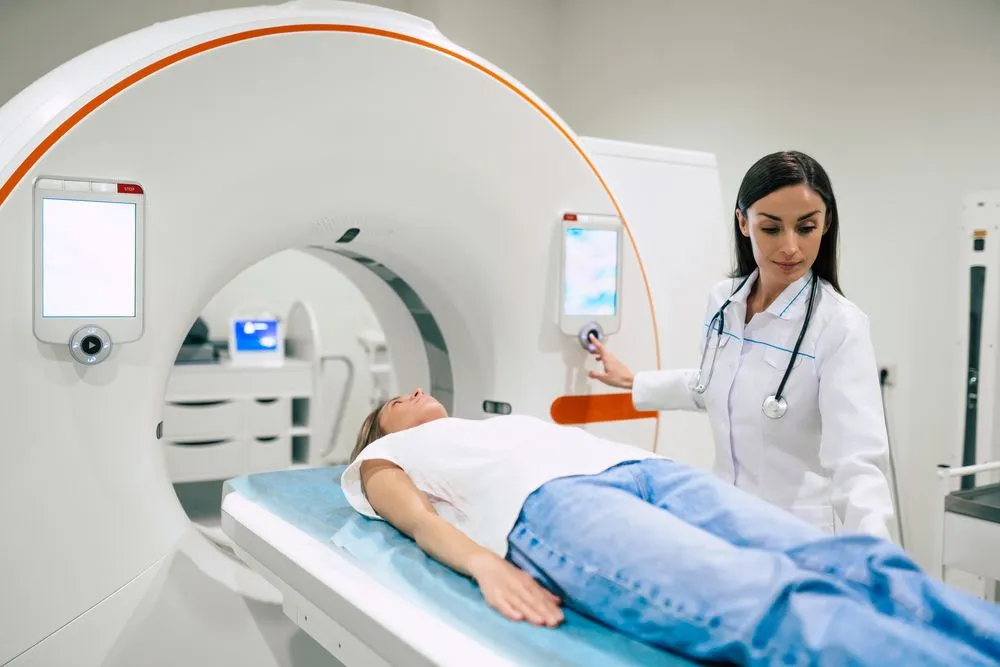
The PET scanner machine detects these gamma rays, and with the help of advanced computing technology, the machine can create a 3D image of the brain’s activity.
At times, PET scans are used in conjunction with other brain imaging techniques like a CT scan or fMRI to get enhanced information about the physiology of the brain.
EEG: Electroencephalogram
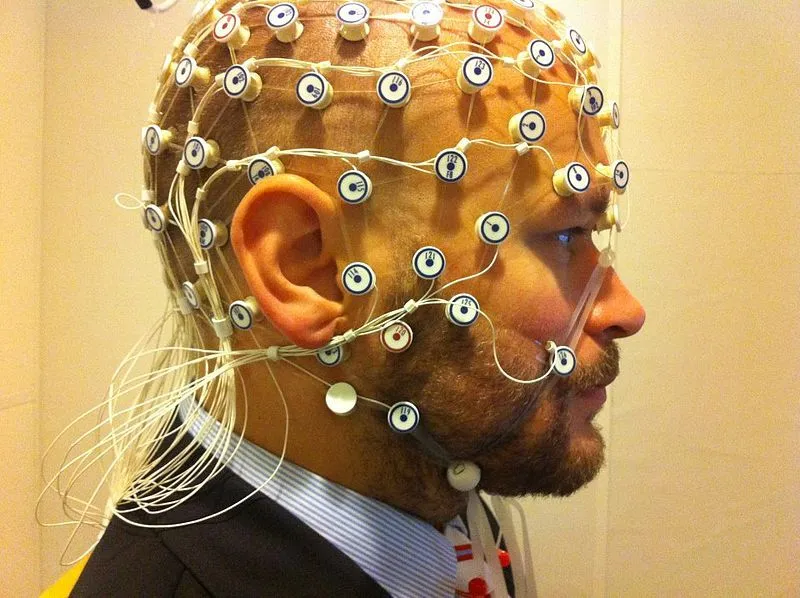
This method isn’t a “brain scan” as the above two are, but it is a way for researchers to understand how the brain works, which is why it is on the list.
Electroencephalography (EEG) is a non-invasive method for monitoring brain activity. German psychiatrist Hans Berger recorded the first human EEG in 1924 and published his findings in 1929, and the technique is still used today to detect brain abnormalities, such as epilepsy, and to confirm the presence of brain activity.
During an EEG, small electrode discs are placed on the scalp. Our brain cells communicate by sending waves of electrical signals to synapses. The electrodes detect these small electrical charges, amplify them and present them as squiggly lines on graphs.
The brain waves are divided into frequency bands, i.e., delta, theta, alpha, beta and gamma. A person in a restful state will show a dominant alpha rhythm that emerges at the back of the head. While falling asleep, the brain will exhibit slower theta activity.
Contrarily, a flat-line EEG signifies an irreversible coma and indicates that the brain is no longer alive.
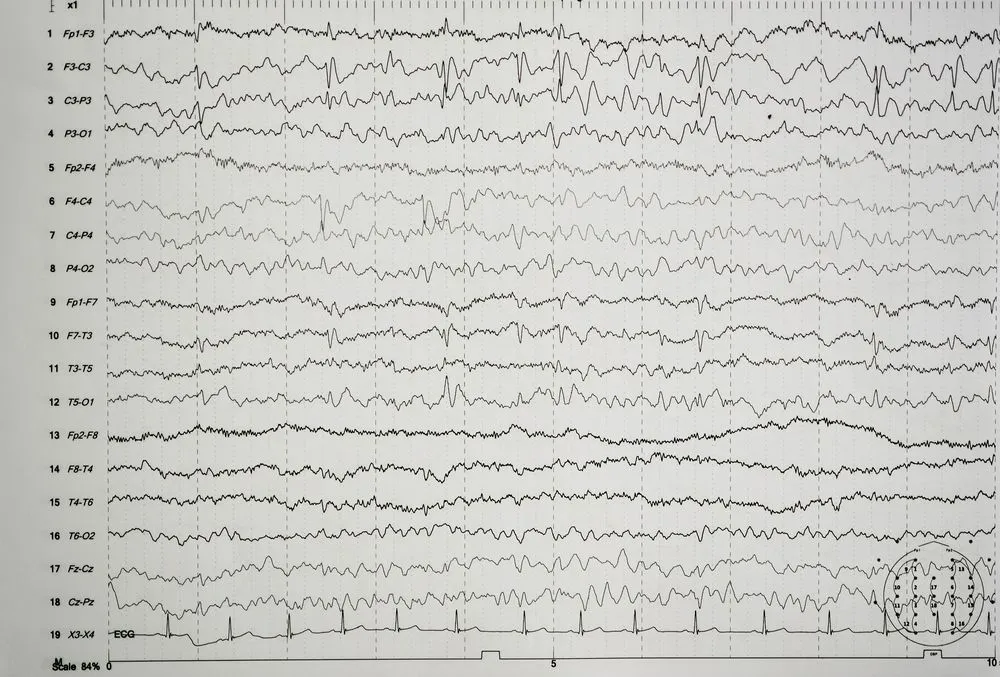
Portability and the ability to track brain activity at the precision of milliseconds gives EEG an edge over other brain imaging techniques. While it can tell precisely when activity occurs, it can’t tell exactly where the source of the signal is due to its poor spatial resolution.
CT and MRI: Imaging the Brain's Structure
The methods above mostly capture the brain in action. Sometimes, though, doctors simply need a clear picture of what the brain looks like, and that is where CT and MRI scans come in.
A computed tomography (CT) scan spins an X-ray beam around the head and stitches the readings into cross-sectional slices of the brain. Because it is fast and widely available, a CT scan is often the first test done in an emergency, helping doctors quickly check for bleeding after head trauma or a stroke.
A magnetic resonance imaging (MRI) scan, on the other hand, uses a strong magnetic field and radio waves (no X-rays) to produce far more detailed images of soft tissue. It excels at spotting tumors, the damage left by multiple sclerosis, and other subtle structural changes that a CT scan might miss.
Here is the key distinction: a regular MRI shows you how the brain is built, while a functional MRI (fMRI) shows you how the brain is working by tracking blood flow. Same machine, different question. CT and MRI map the brain's anatomy, whereas fMRI, PET, and EEG follow its moment-to-moment activity.
Conclusion
Electricity is the universal language of brains, and many imaging techniques work by intercepting these electrical signals (or the blood flow they trigger) as they are passed around in the brain, while others simply map its physical structure. Such advanced brain scan technologies not only help in the detection of brain abnormalities, but also help us understand how different parts of the brain interact with each other and perform everyday tasks so effortlessly!
References (click to expand)
- Casson, A. J., Abdulaal, M., Dulabh, M., Kohli, S., Krachunov, S., & Trimble, E. (2017, November 25). Electroencephalogram. Seamless Healthcare Monitoring. Springer International Publishing.
- Electroencephalogram (EEG) | Johns Hopkins Medicine. hopkinsmedicine.org
- Holdsworth, S., & Bammer, R. (2008, September). Magnetic Resonance Imaging Techniques: fMRI, DWI, and PWI. Seminars in Neurology. Georg Thieme Verlag KG.
- Matthews, P. M., & Jezzard, P. (2006, November). Functional Magnetic Resonance Imaging. Neuroscience for Neurologists. PUBLISHED BY IMPERIAL COLLEGE PRESS AND DISTRIBUTED BY WORLD SCIENTIFIC PUBLISHING CO.
- Introduction to FMRI. The University of Oxford
- (2005) Positron emission tomography: principles, technology, and .... Ohio University
- Positron Emission Tomography (PET) | Johns Hopkins Medicine. hopkinsmedicine.org
- Berger, A. (2003, June 26). Positron emission tomography. Bmj. BMJ.
- Computed Tomography (CT). National Institute of Biomedical Imaging and Bioengineering (NIBIB), NIH.
- Magnetic Resonance Imaging (MRI). National Institute of Biomedical Imaging and Bioengineering (NIBIB), NIH.
- Tudor, M., Tudor, L., & Tudor, K. I. (2020). The inventor of electroencephalography (EEG): Hans Berger (1873-1941). Child's Nervous System. Springer.