Table of Contents (click to expand)
The yield strength of a material is the stress at which it stops behaving elastically and begins to deform permanently. It is calculated as force per unit area (σ = F/A) and is typically expressed in megapascals (MPa) or pounds per square inch (psi). Mild steel yields around 250 MPa, structural aluminum alloys at 95–280 MPa.
Yield strength is one of the most important numbers an engineer ever looks up about a material. It tells you exactly when a piece of metal stops springing back to its original shape and starts to deform for keeps. The point at which a material ceases to be elastic and becomes permanently plastic (the point at which it yields) is called its yield point, and the stress required to reach it is the yield strength.
For an engineer, thoroughly studying the properties of a material is an absolute necessity before venturing into any new project. Imagine the horrific consequences if the engineers building the Brooklyn Bridge had been shamelessly ignorant and used plastic or bricks instead of steel. On the other hand, if most of today’s toys were built from steel and not something as pliant as plastic, they would’ve been impossible to mold into the most eccentric of shapes we so adore.

In short: every material has a stress threshold called its yield strength. Below it, the material springs back; above it, the deformation is permanent. The number is usually quoted in megapascals (MPa) in SI units or pounds per square inch (psi) in the US, with 1 MPa ≈ 145 psi.
The Stress-Strain Graph
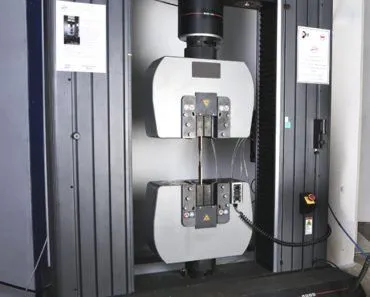
The strength of a material is determined by a tensile test, a test that requires the material to be mercilessly pulled from its two ends. The relationship between the stress to which it is subjected and the strain it consequently suffers can be limned by a graph called the stress-strain curve.
We have already explained the graph in detail in a previous article, which you’ll find here. However, this will be a quick crash course.
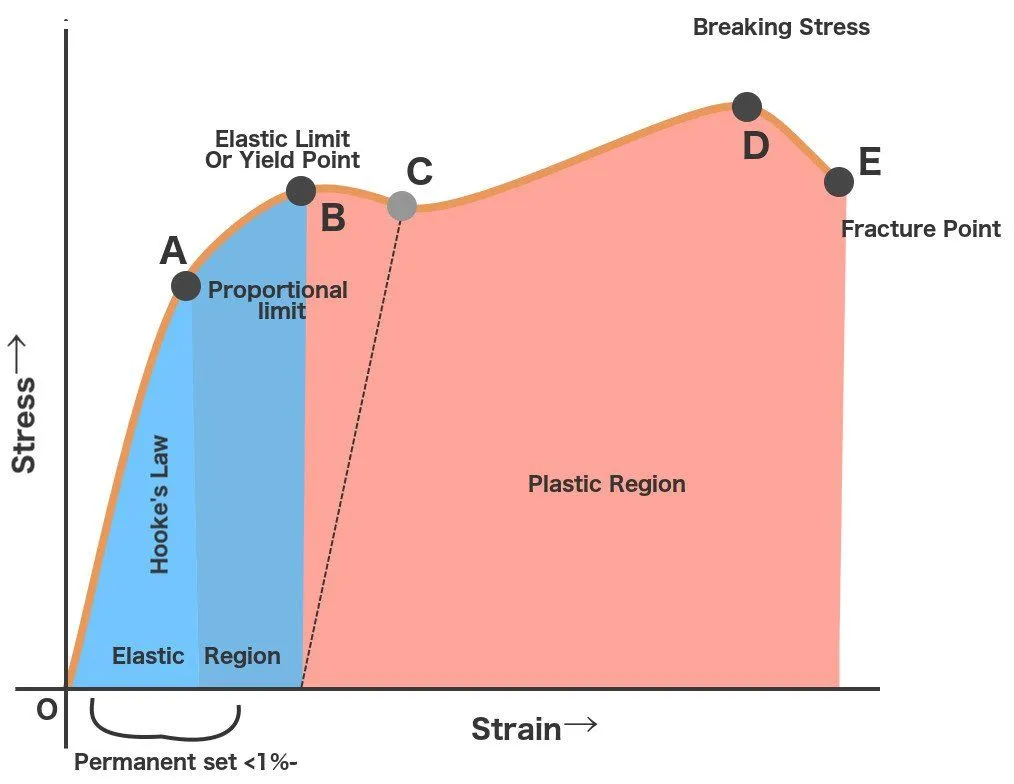
Initially, a material, even steel, behaves like an elastic when stretched. When within the elastic limit, the strain caused by the stress is reversible; yes, the material elongates, but once the stress is released, it retains its original length. This elasticity, however, is not permanent. Excess stress will deform a material permanently.
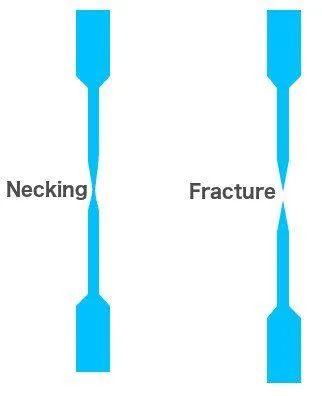
In fact, applying greater stress causes the formation of what is called a ‘neck’ along the deformation. The neck is analogous to the ropes of cheese that barely hold the slice and the rest of the pizza together. An even greater stress will break the neck as well, and the material ultimately succumbs to the stress and suffers a tragic breakage or fracture.
Yield Strength
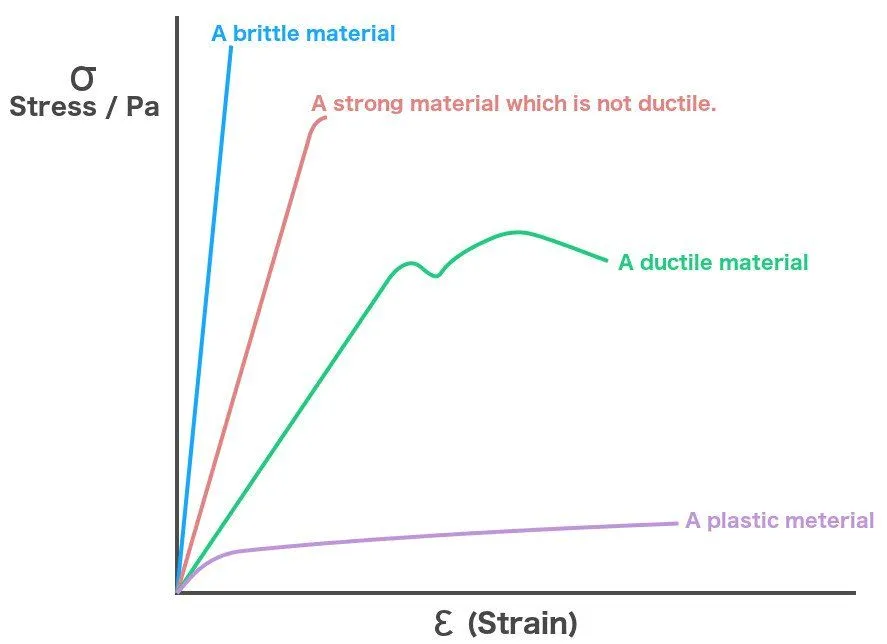
Each and every material draws its own characteristic stress-strain curve, which allows us to determine what applications are suitable for its use. Each material’s curve exhibits different points of transitions, from elasticity to plasticity and finally to breakage.
The point at which a material ceases to be elastic and becomes permanently plastic, the point at which it yields, is called its yield point. The magnitude of stress at which this transition occurs is known as the material’s yield stress or strength. The yield strength is a material constant that represents the limit of its elastic behavior. Ductile materials like iron boast higher yield strength values than plastics, such as polyethylene.

A ductile material like iron is not permanently deformed because its atoms “break”, but because the stress exerted is persuasive enough to overcome its lattice energy and disturb the material’s rigid structure; it is enough to literally displace the atoms from its crystals. This phenomenon is called crystalline dislocation.
Plastics deform more easily because they succumb to dislocations more easily than ductile materials do. There are also brittle materials, which have absolutely no concept of yield stress. These materials, when subjected to a stress greater than the yield stress, as the name suggests, don’t undergo any transition from elasticity to plasticity, but directly break instead.
Lastly, because the yield strength of a material essentially determines its tolerance for tension, engineers realized they had to devise clever ways to increase it. One classic trick is to add deliberate “impurities” (solute atoms) that distort the host crystal lattice and pin dislocations in place, making them harder to move. Alloys like steel, in which iron is laced with carbon and other elements, are the textbook example of this solid-solution strengthening. Other tricks include shrinking the grains (Hall–Petch strengthening), cold-working the metal to tangle dislocations, and precipitation hardening, the principle behind aircraft-grade aluminum alloys like 7075, which can yield above 500 MPa, more than twenty times stronger than the pure metal.
Another way to achieve a greater yield stress is to work the material at lower temperatures. Higher temperatures actually lower the yield strength, since thermal energy keeps the atoms vigorously jiggling and helps them slip past lattice obstacles. The material is, in a sense, halfway to yielding before you even pick up the hammer, so an external stress now requires far less energy to drive dislocations and produce permanent deformation. Why else would you think we must strike while the iron’s hot?
How Do You Find Yield Strength? The 0.2% Offset Method
Here is the awkward secret of yield strength: for most metals, there is no single obvious spot on the curve that screams “this is where elasticity ends.” The transition from springing-back to staying-bent is gradual, a smooth bend rather than a sharp corner. So how do engineers pin down a number everyone can agree on? They cheat, politely, with a rule called the 0.2% offset method.

The recipe is simple. Start at a strain of 0.2% (that is 0.002, or 0.2 mm of stretch per 100 mm of length) on the horizontal axis, then draw a straight line from there running exactly parallel to the elastic, straight-line part of the curve. Wherever that offset line crosses the real stress-strain curve, that stress is the offset yield strength. In effect, you are asking: at what stress would the material be left with a permanent stretch of 0.2% after you let go? That is also why an offset yield is sometimes called the proof stress.
This is the method written into testing standards like ASTM E8, and it is the only sensible option for materials such as aluminum and stainless steel that have no distinct yield point at all. By the time a metal reaches its offset yield point, it has already nudged past its true elastic limit and taken on a sliver of permanent strain roughly equal to the offset. The 0.2% figure is a convention, not a law of nature: softer offsets like 0.1% are sometimes used, but 0.2% is the workhorse engineers reach for by default.
What Are the Units and Symbol of Yield Strength?
Because yield strength is a stress, it carries the units of stress: force divided by area. In SI units that is the pascal (Pa), but a pascal is tiny (one newton spread over a whole square meter), so real materials are quoted in megapascals (MPa), where 1 MPa is one million pascals, or equivalently one newton per square millimeter (1 MPa = 1 N/mm2). In the United States the same number is often written in pounds per square inch (psi) or thousands of psi, called ksi. The handy conversion is 1 MPa ≈ 145 psi, so a mild steel yielding at 250 MPa is the same as about 36 ksi.
As for notation, yield strength is almost always written as σy, where the Greek letter sigma (σ) is the universal symbol for stress and the subscript y simply stands for “yield.” You will sometimes see it as Sy in older American texts, or Re (and Rp0.2 for the 0.2% proof stress) in European standards, but they all point at the same property. Whenever you see σy on a datasheet, it is telling you the stress at which that material stops forgiving you and starts to keep the dent.
Yield Strength vs. Yield Stress, Elastic Limit, and Ultimate Tensile Strength
These terms get thrown around as if they were interchangeable, and a couple of them genuinely are. Let's untangle them, because the differences matter once you are choosing a material rather than just memorizing it.

- Yield stress vs. yield strength: these two are the same thing. Both name the stress at the yield point, and engineers use the words interchangeably. So if a search told you they differ, relax, they don't.
- Proportional limit: the stress up to which stress and strain stay strictly proportional, the straight-line region where Hooke's law holds and the slope equals the material's stiffness (its Young's modulus).
- Elastic limit: the very last stress at which the material still springs all the way back to its original shape. Slightly above the proportional limit and so close to the yield strength that the offset yield is used as a practical stand-in for it.
- Ultimate tensile strength (UTS): the maximum stress the material can carry, the peak of the whole curve. Past the yield point a metal keeps getting stronger as it stretches (strain hardening) until it reaches UTS, after which a neck forms and the stress falls away to fracture.
The short version: the elastic limit and yield strength mark where a material stops being springy, while the ultimate tensile strength marks where it is about to break. That gap between the two is precious, because it is the warning a beam gives, bending visibly before it ever snaps.
Yield Strength of Common Materials: Steel, Aluminum and More
Yield strength is enormously sensitive to which alloy and which heat treatment you are holding, not just to the base metal. Pure, soft aluminum is feeble; the precipitation-hardened 7075 alloy in an aircraft spar is in another league entirely, even though both are “aluminum.” Here are representative room-temperature yield strengths for materials people search for most, drawn from standard engineering data tables.
| Material | Yield strength (MPa) | Yield strength (ksi) |
|---|---|---|
| Soft (1100-O) aluminum | ~34 | ~5 |
| Structural aluminum 6061-T6 | ~276 | ~40 |
| Aircraft aluminum 7075-T6 | ~505 | ~73 |
| Mild / structural steel (ASTM A36) | ~250 | ~36 |
| 304 stainless steel (annealed) | ~235 | ~34 |
| Quenched-and-tempered alloy steel (AISI 4340) | ~1,145 | ~166 |
| Titanium Ti-6Al-4V (annealed) | ~830–910 | ~120–132 |
A few things jump out. First, the same family of metal can span a factor of fifteen depending on processing: 1100 aluminum yields near 34 MPa, while 7075-T6 clears 500 MPa. Second, “structural steel” and “mild steel” usually mean a yield around 250 MPa, but heat-treated alloy steels reach well past 1,000 MPa. And titanium punches above its weight, matching strong steels at little more than half the density, which is exactly why it ends up in jet engines and bike frames. When an engineer “looks up yield strength,” this is the table they are reaching for, and the precise temper after the alloy name is doing most of the work.
References (click to expand)
- The University of Virginia. University of Virginia
- Yield strength | School of Materials Science and Engineering. The University of New South Wales
- Offset Yield Strength. Instron Glossary
- Stress-Strain Curves (David Roylance), 3.11 Mechanics of Materials. MIT OpenCourseWare
- Yield Strength of Steel Chart. AmesWeb
- Aluminum Yield and Tensile Strength Chart. AmesWeb
- Yield-Point Phenomenon and Plastic Bands in Ferrite–Pearlite Steels. Materials (Basel), 2022. PMC